Trace Monitor
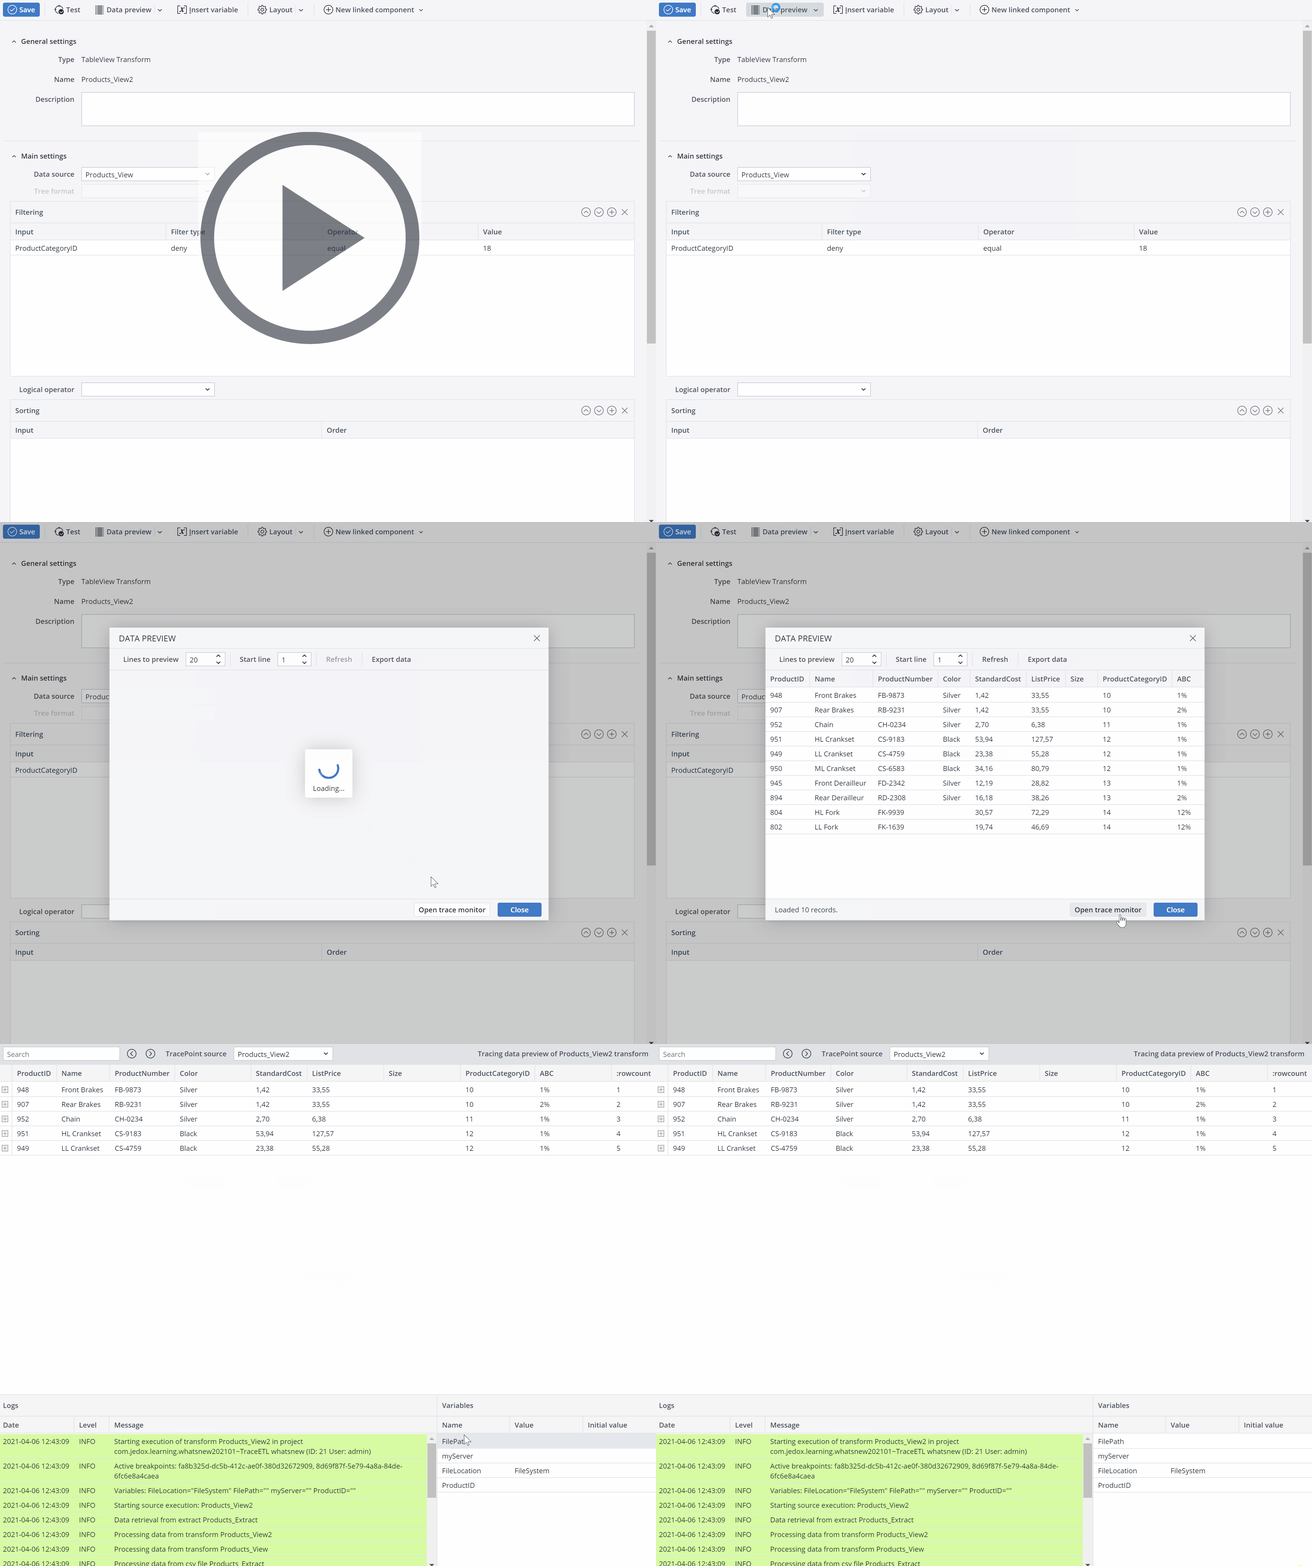
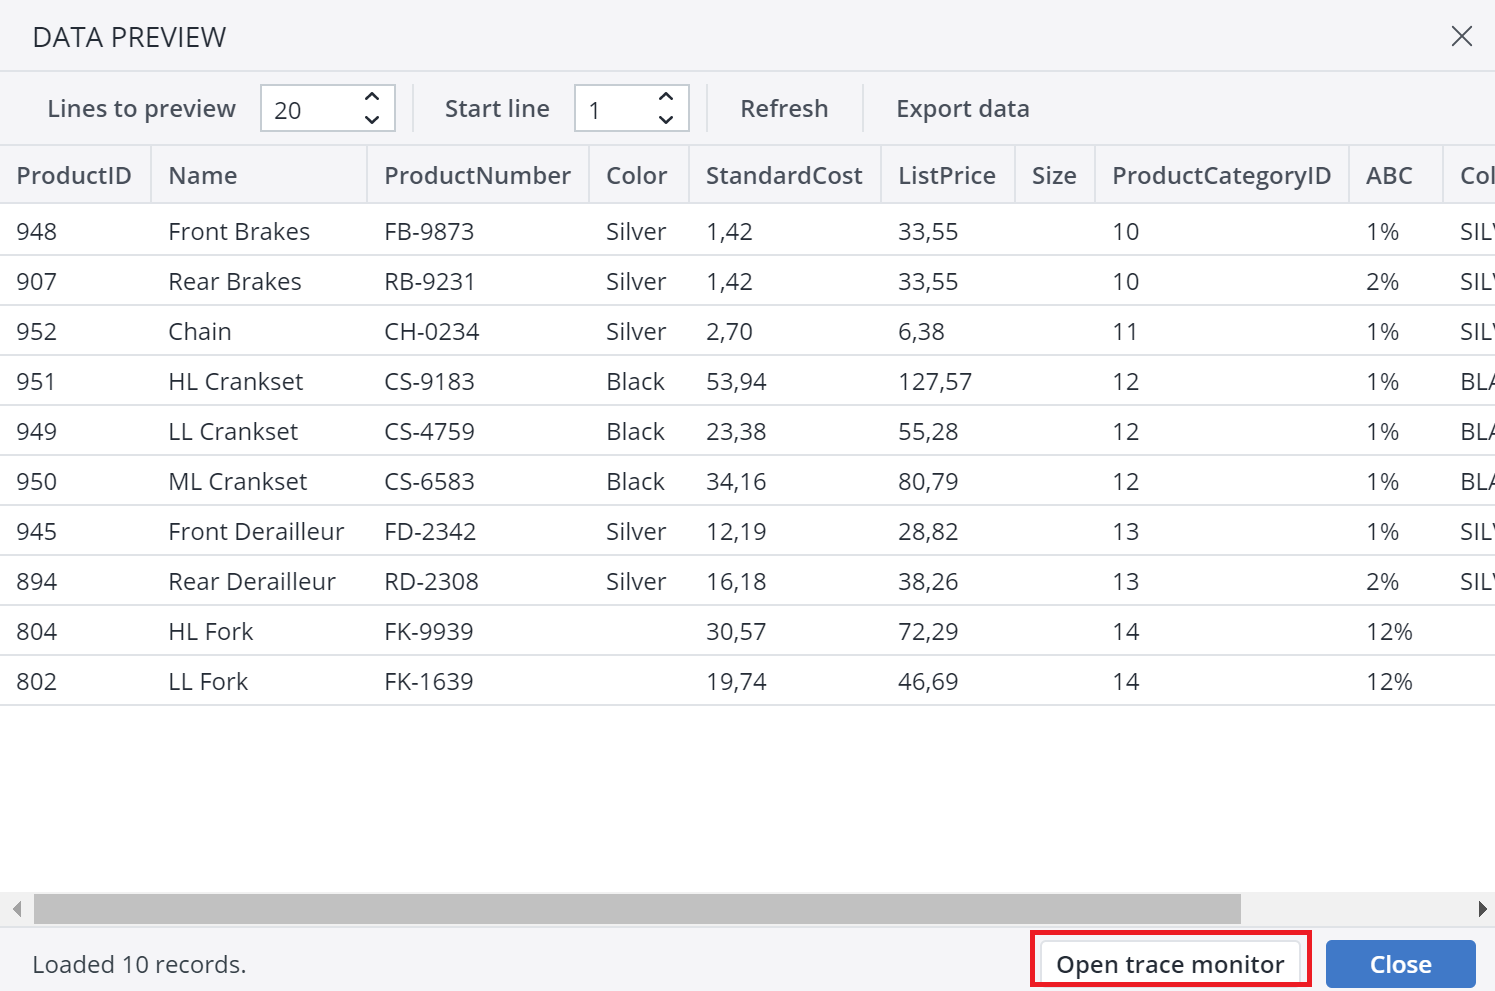
The Trace Monitor provides information about how the traced value has changed during the process. To open the Trace monitor, open the Extract, Transform, or Job that has an active TracePoint. Click on the Data preview and then click on Open trace monitor.
Note that the Open trace monitor button is active only when the TracePoint is activated.
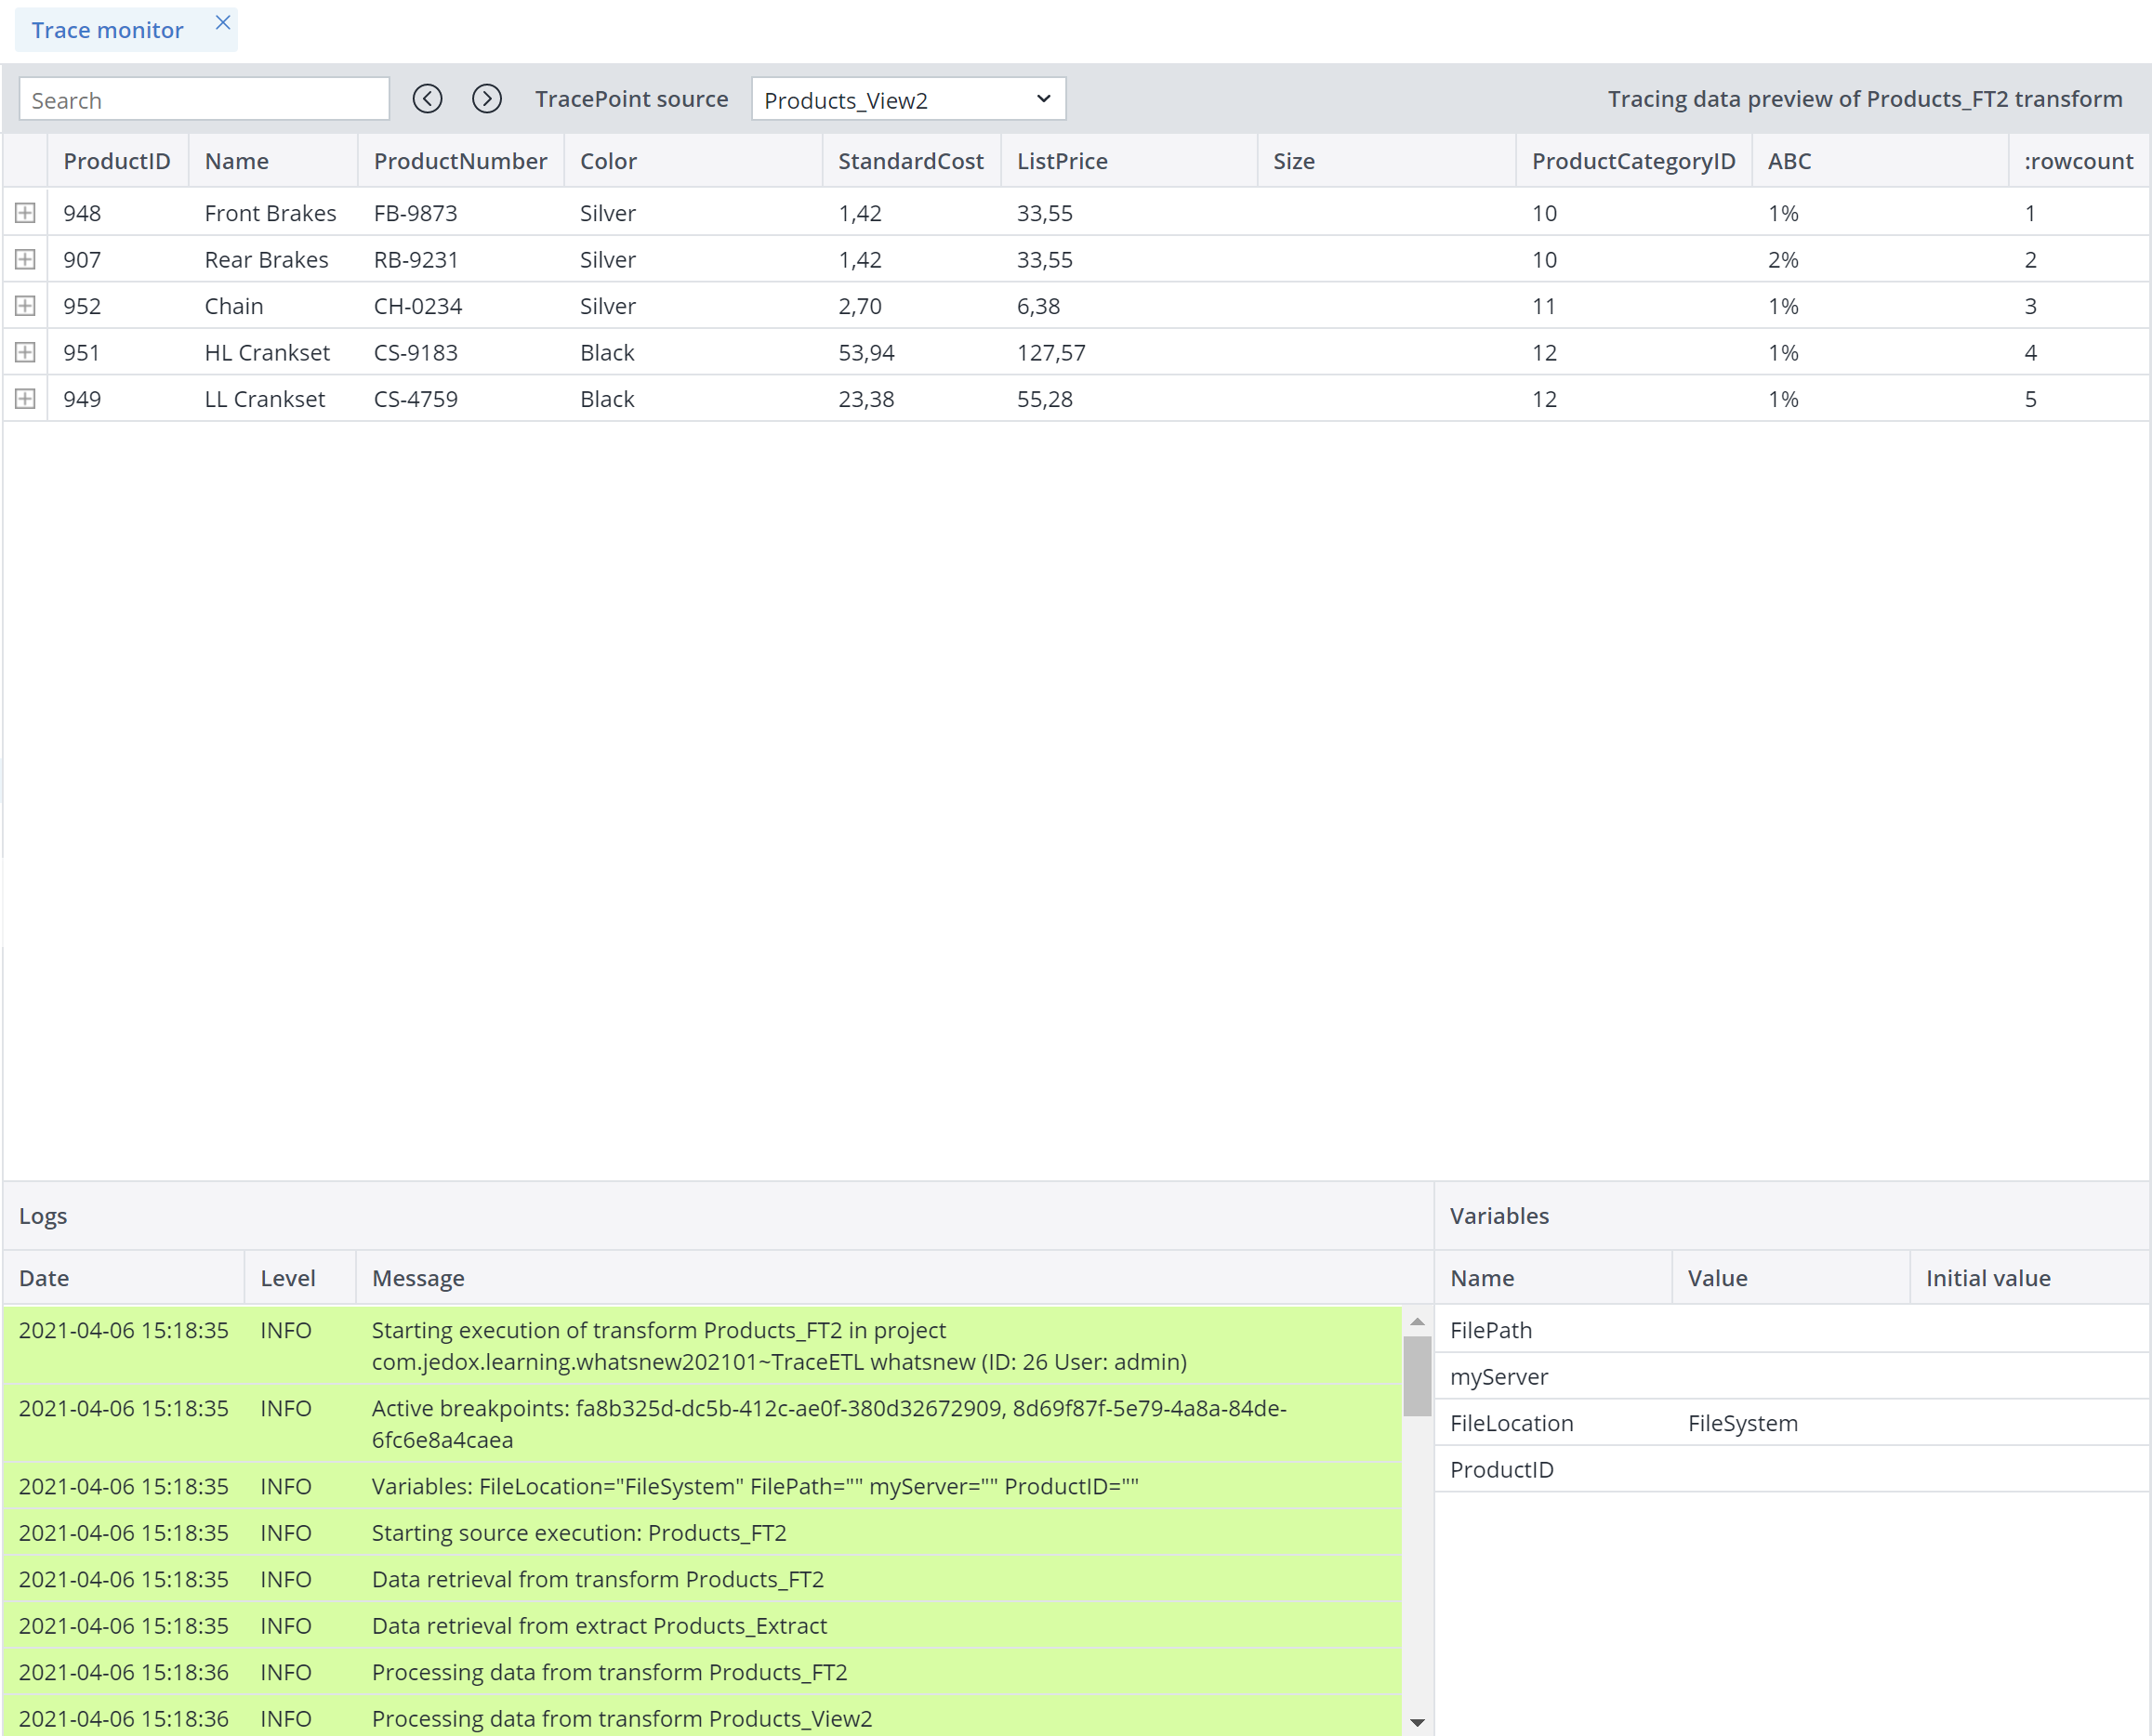
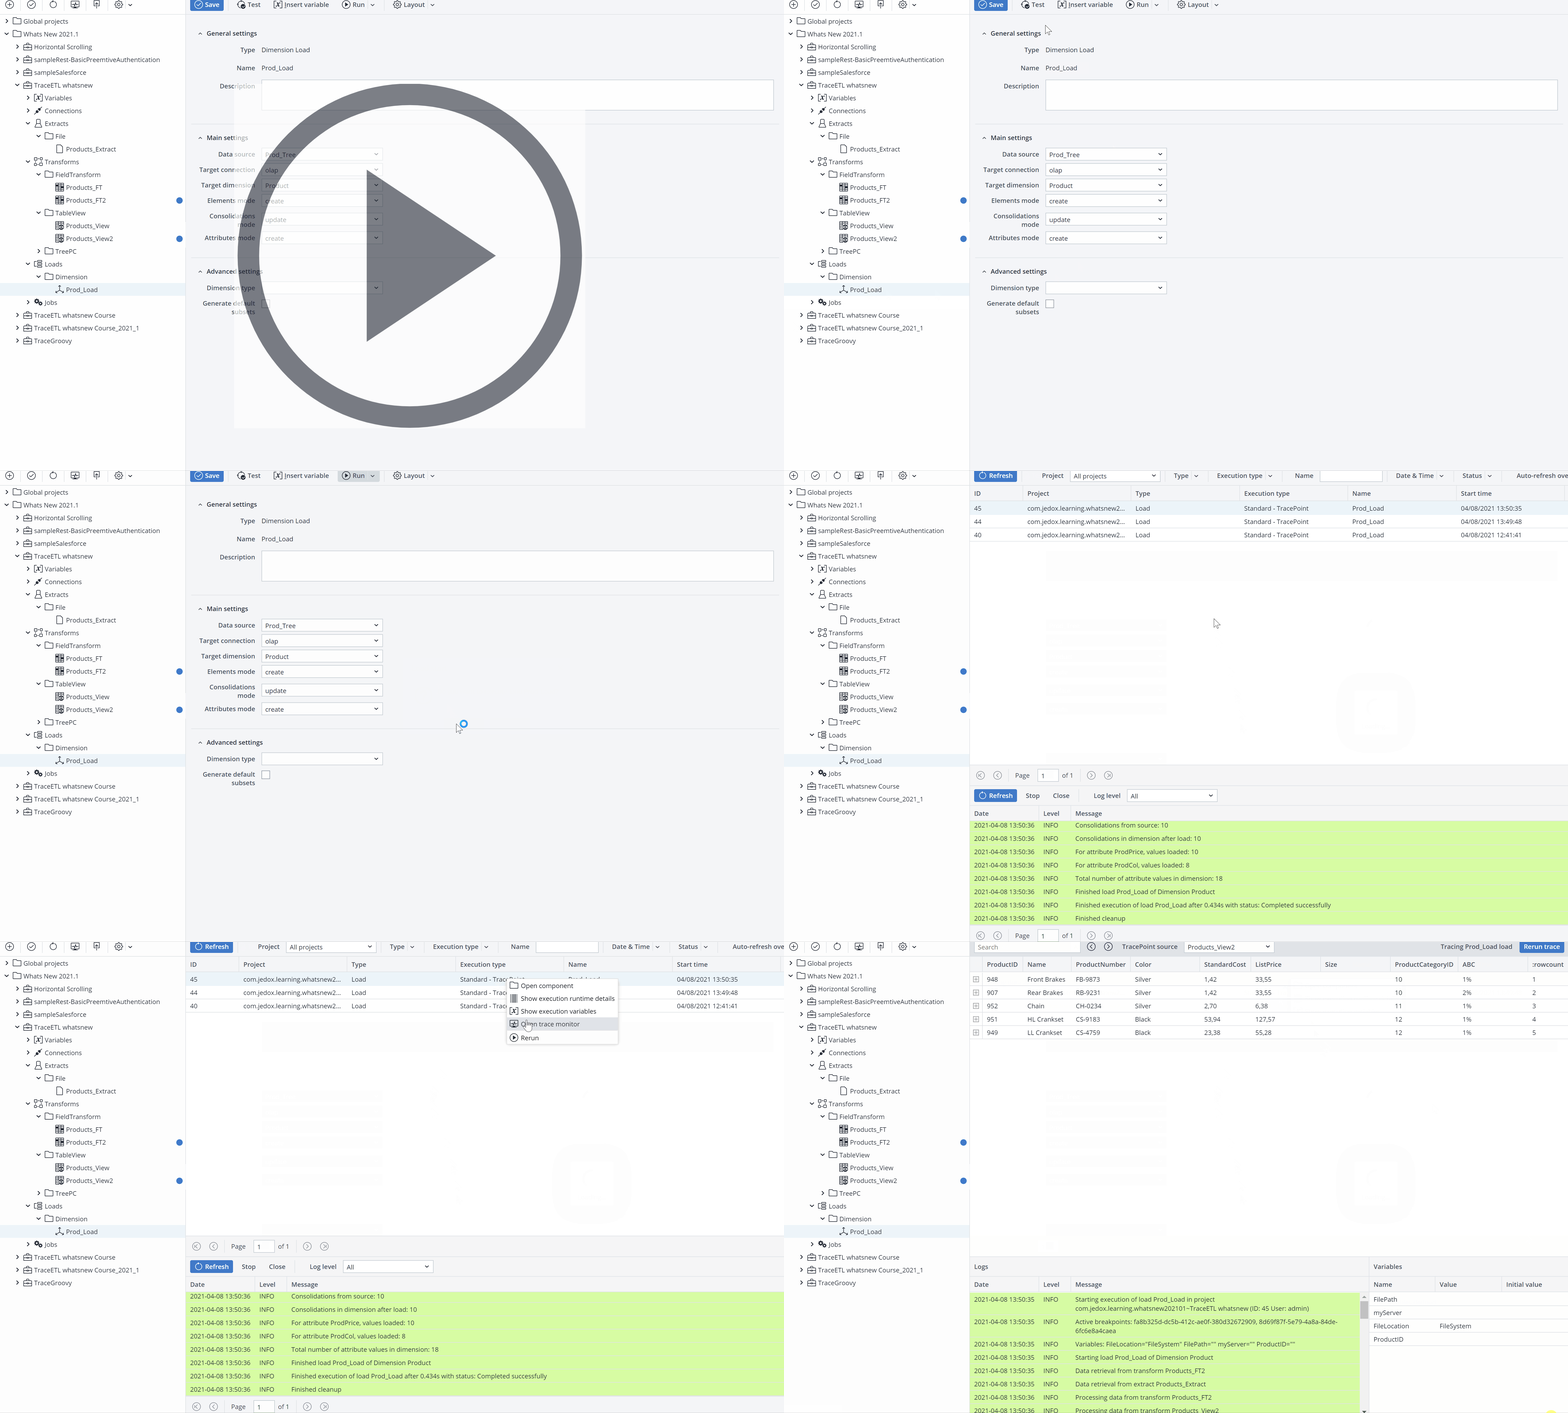
Click on the Open trace monitor button.The Trace monitor opens, showing all the related TracePoints.
The following information and options can be found in the Trace monitor.
| Search |
|
You can use search to quickly find specific data.
|
| TracePoint source |
|
You can choose/change the source of the TracePoint here.
|
| Trace data |
|
Here you can see all the data that applies to the TracePoint filter you have set up. For each TracePoint hit, the row value of the source with the corresponding row number is displayed. You can expand the items in the Trace data section and see the flow of data. For each supported component, you can follow the data in different sections (e.g., in Extracts, Transforms, etc.)
By selecting one row in the case of Transforms, the row values of the underlying sources can also be shown to see this value's origin. (Note that this option does not work for all Transform types.) Note: the displayed data are the current variable values at the moment the Trace condition was hit. |
| Trace logs |
|
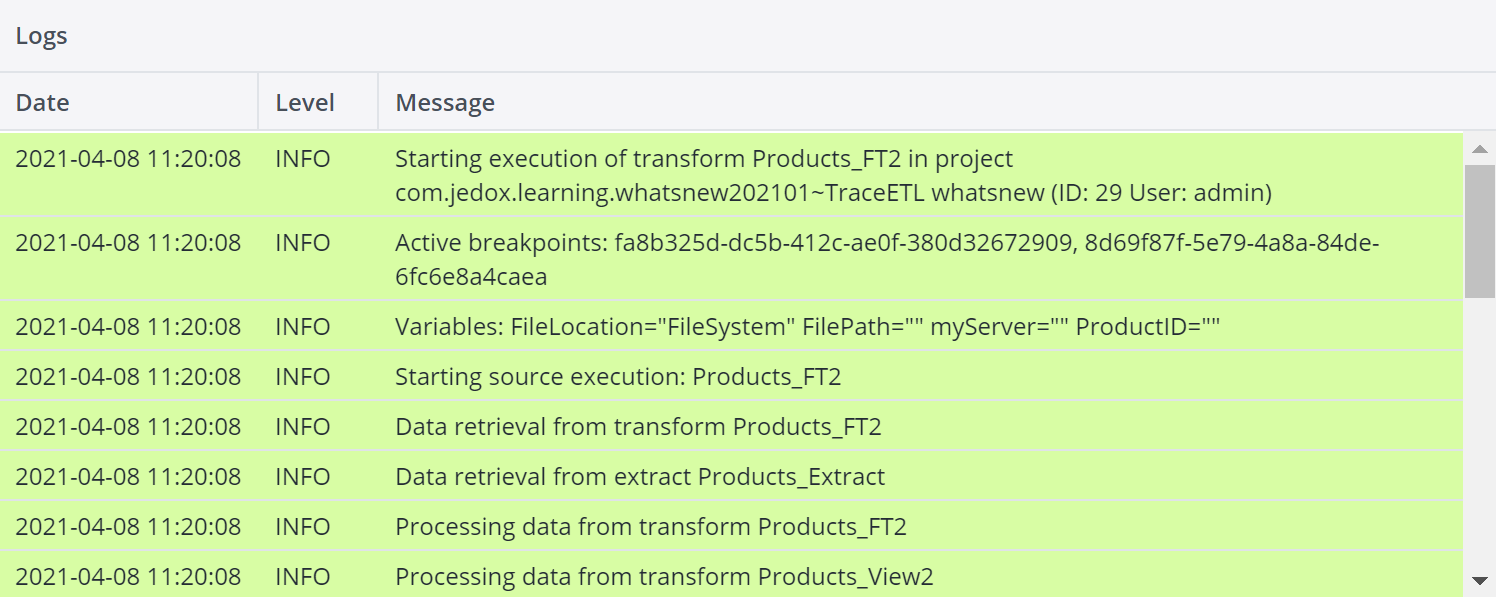
This section generates log files containing output messages about the activity of the components, error messages, and warnings. |
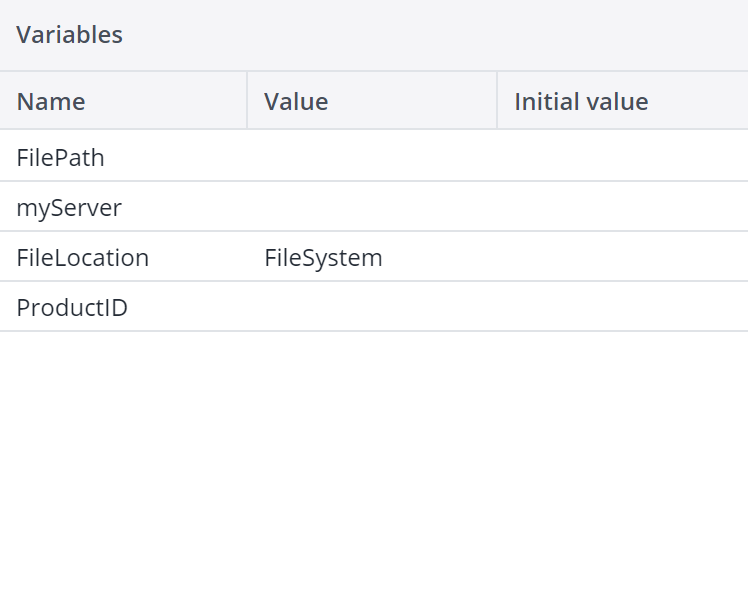
| Trace variables |
|
In this section, you can find information on the variables. |
For tracing values when the data is significantly huge, you can open the Trace monitor through a load. To do this, execute the load by clicking on the Run button. In the list that shows up, in the Execution type section, right-click on the load with the word “TracePoint”. Choose Open trace monitor.
Updated July 21, 2025
