The cell tracer allows you to trace the origin of calculated values on PALO.DATA* cells. It shows the calculation time, number of cells being drawn on, the number of rule-calculated cells, and so on. The cell tracer dialog is available in the Report Designer component of Jedox Web and in Excel spreadsheets.
To use the cell tracer in an Excel report or Jedox Web spreadsheet, right-click on a specific cell and select Trace Cell Value.
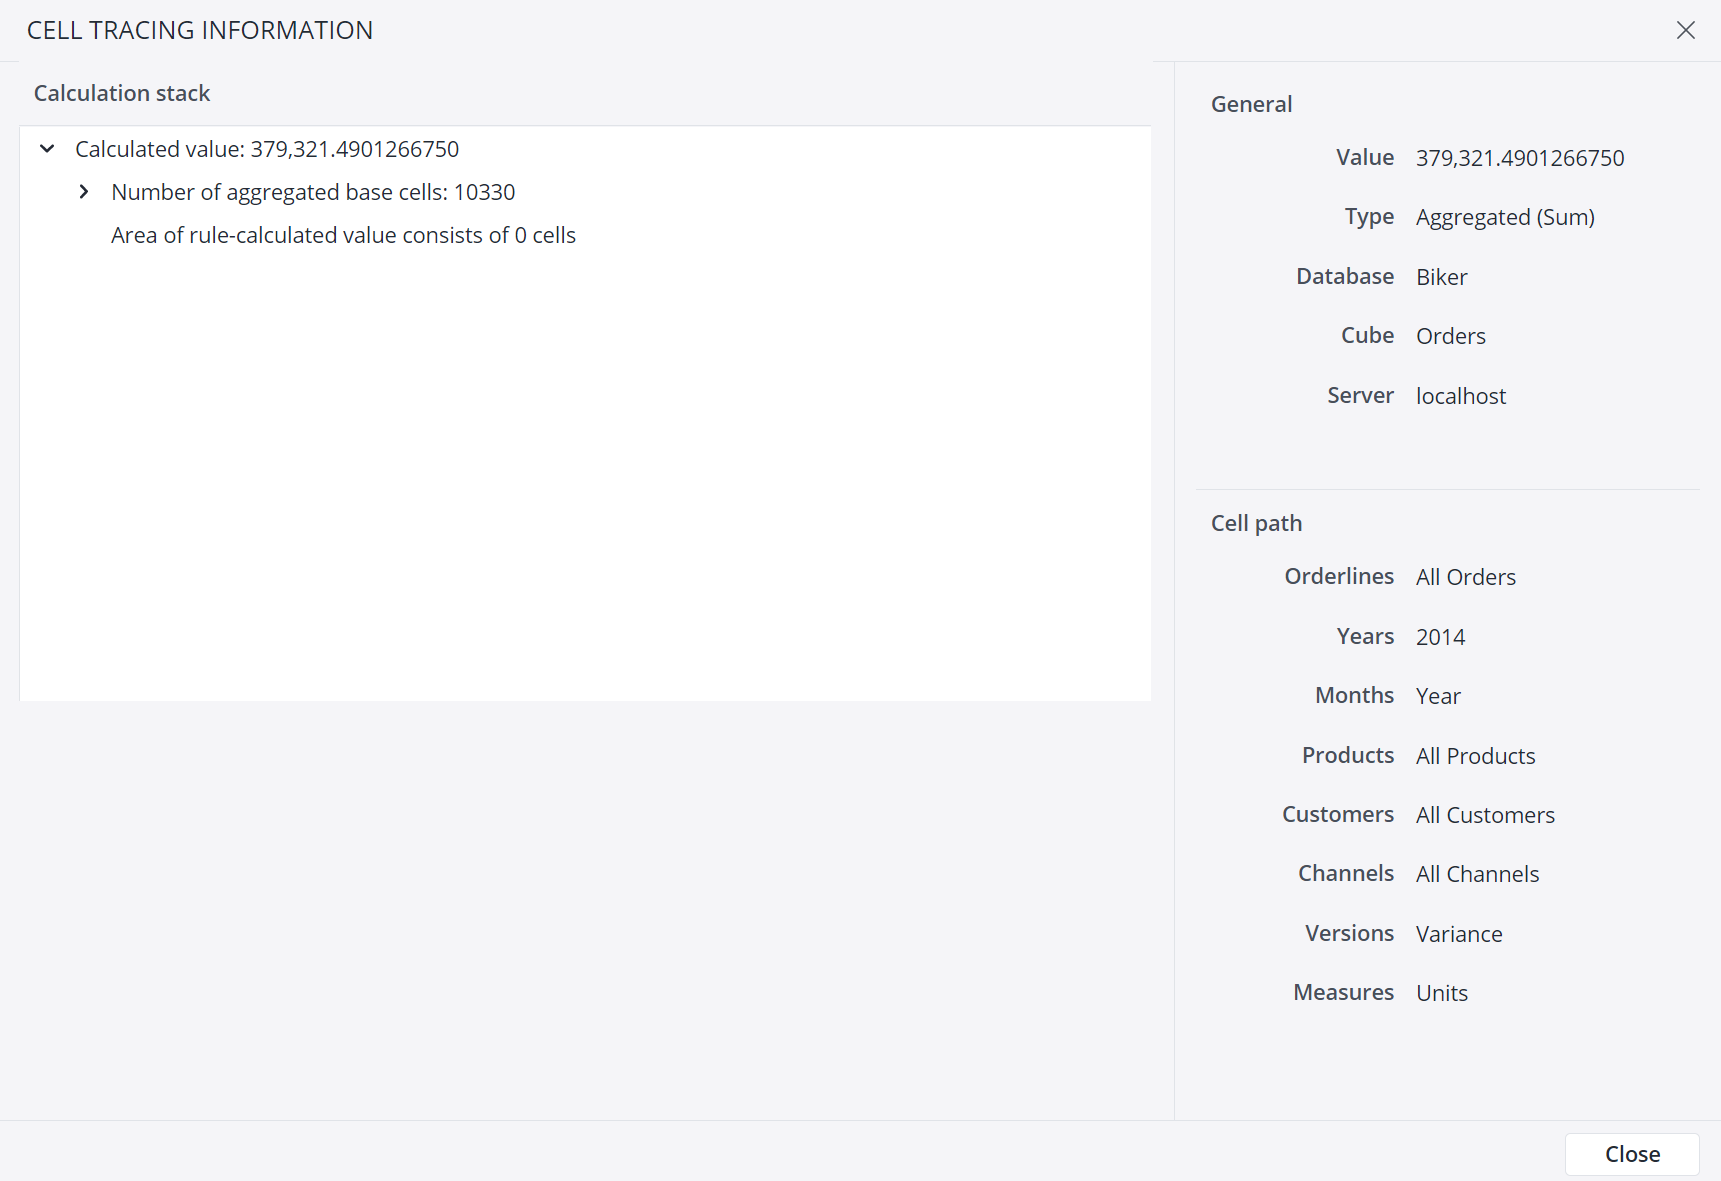
The screenshot below shows the information for an aggregated cell:
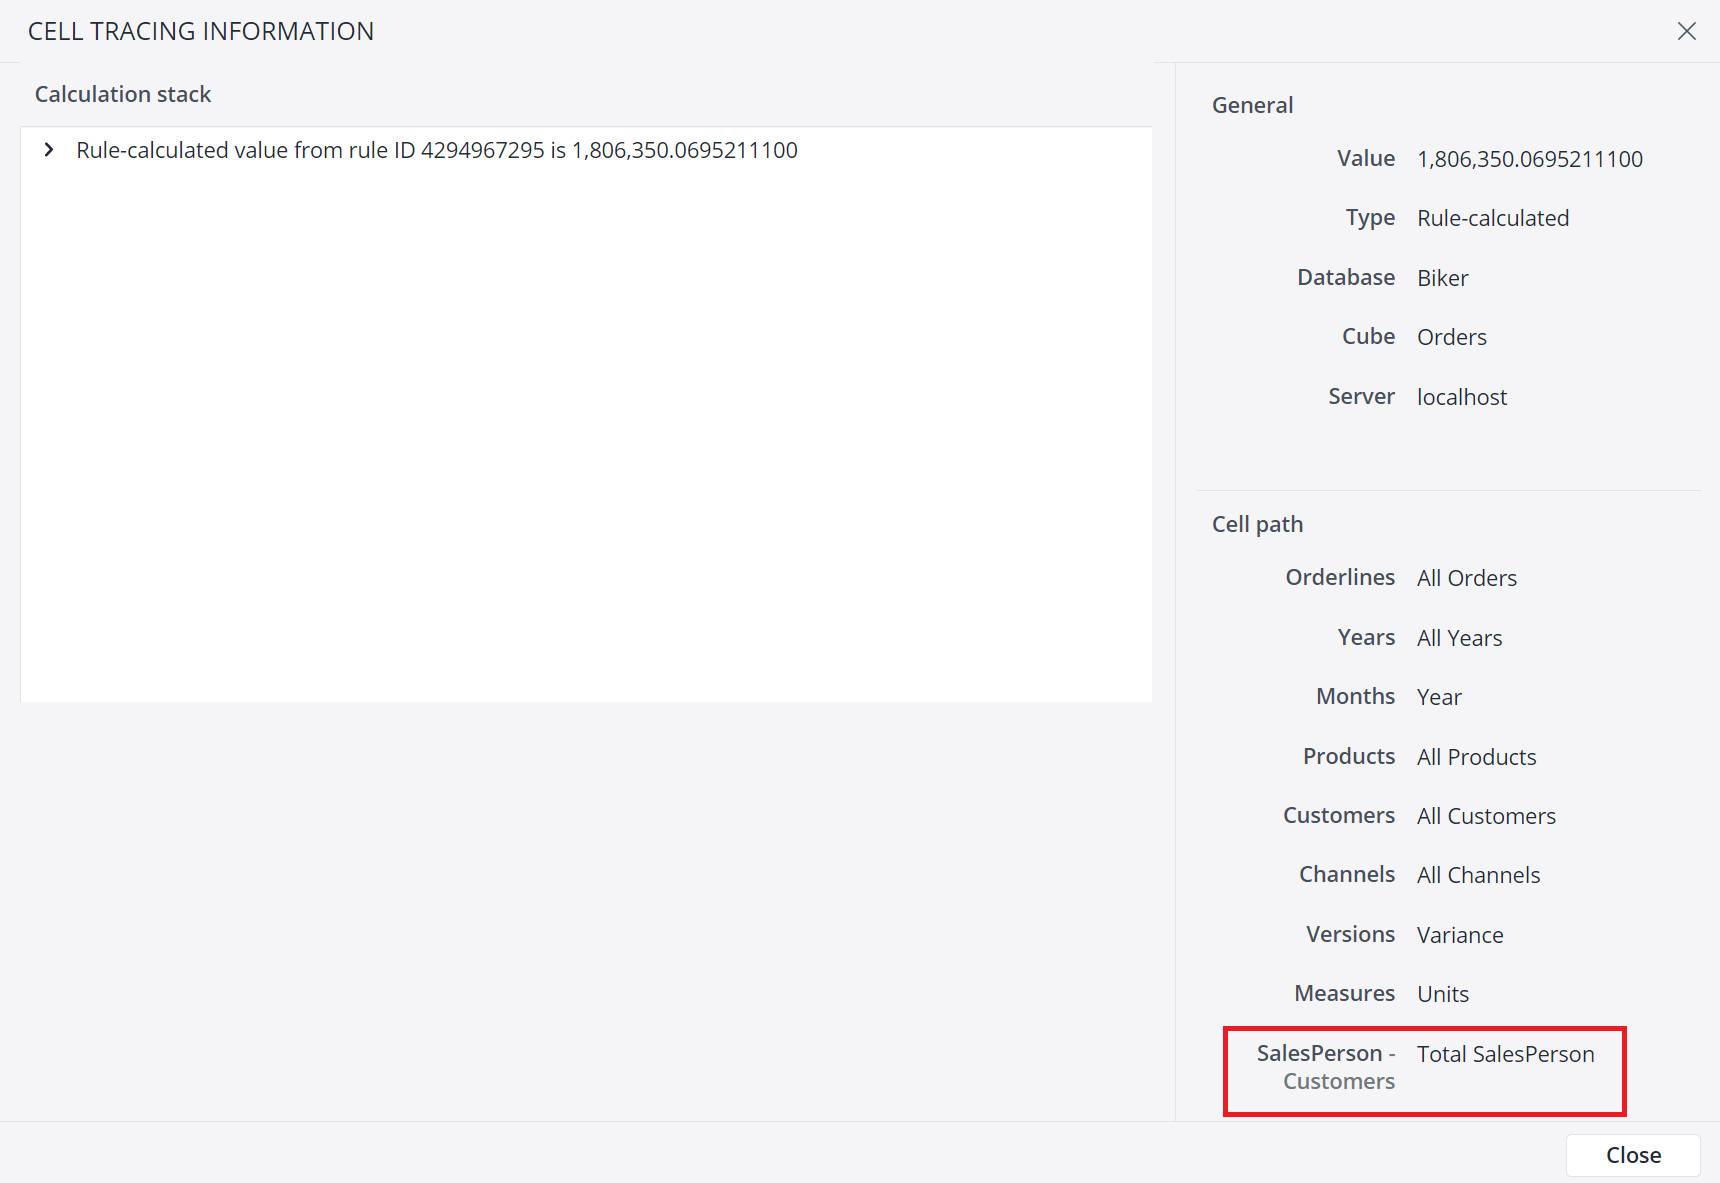
With the Cell Tracer, you can also get information about the Virtual Dimensions used to calculate an OLAP value in a spreadsheet cell and determine the exact origins of the value. The information about the Virtual Dimension is shown in the "Cell path" section of the Cell Tracer dialog.
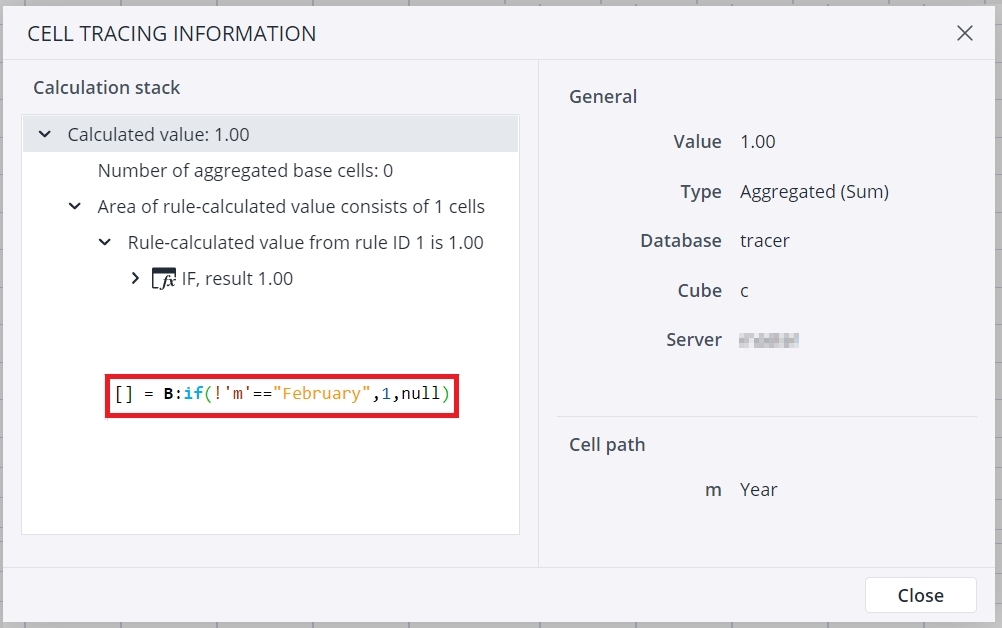
Rule-calculated cells with "null" results are not displayed when expanded as part of an aggregation. The screenshot below shows the Year expanded with an aggregation of 12 cells: January to December. When all cells except February are evaluated as "null", only the value for February is visible in the expanded aggregation, even though the other 11 cells were calculated using the same rule.
In complex models, it is sometimes very useful to examine ratios, drivers, and inputs at an extended decimal level. The Cell Tracer shows values up to 10 decimal places.
The Cell Tracer also works on views where not all dimensions are visible in the POV area, even if the hidden dimensions do not have a default read element defined.
Updated July 21, 2025


