In this example, we want to display the top ten products of the 4th quarter of 2014 from the Demo database. First we create a control view with the Paste View command:
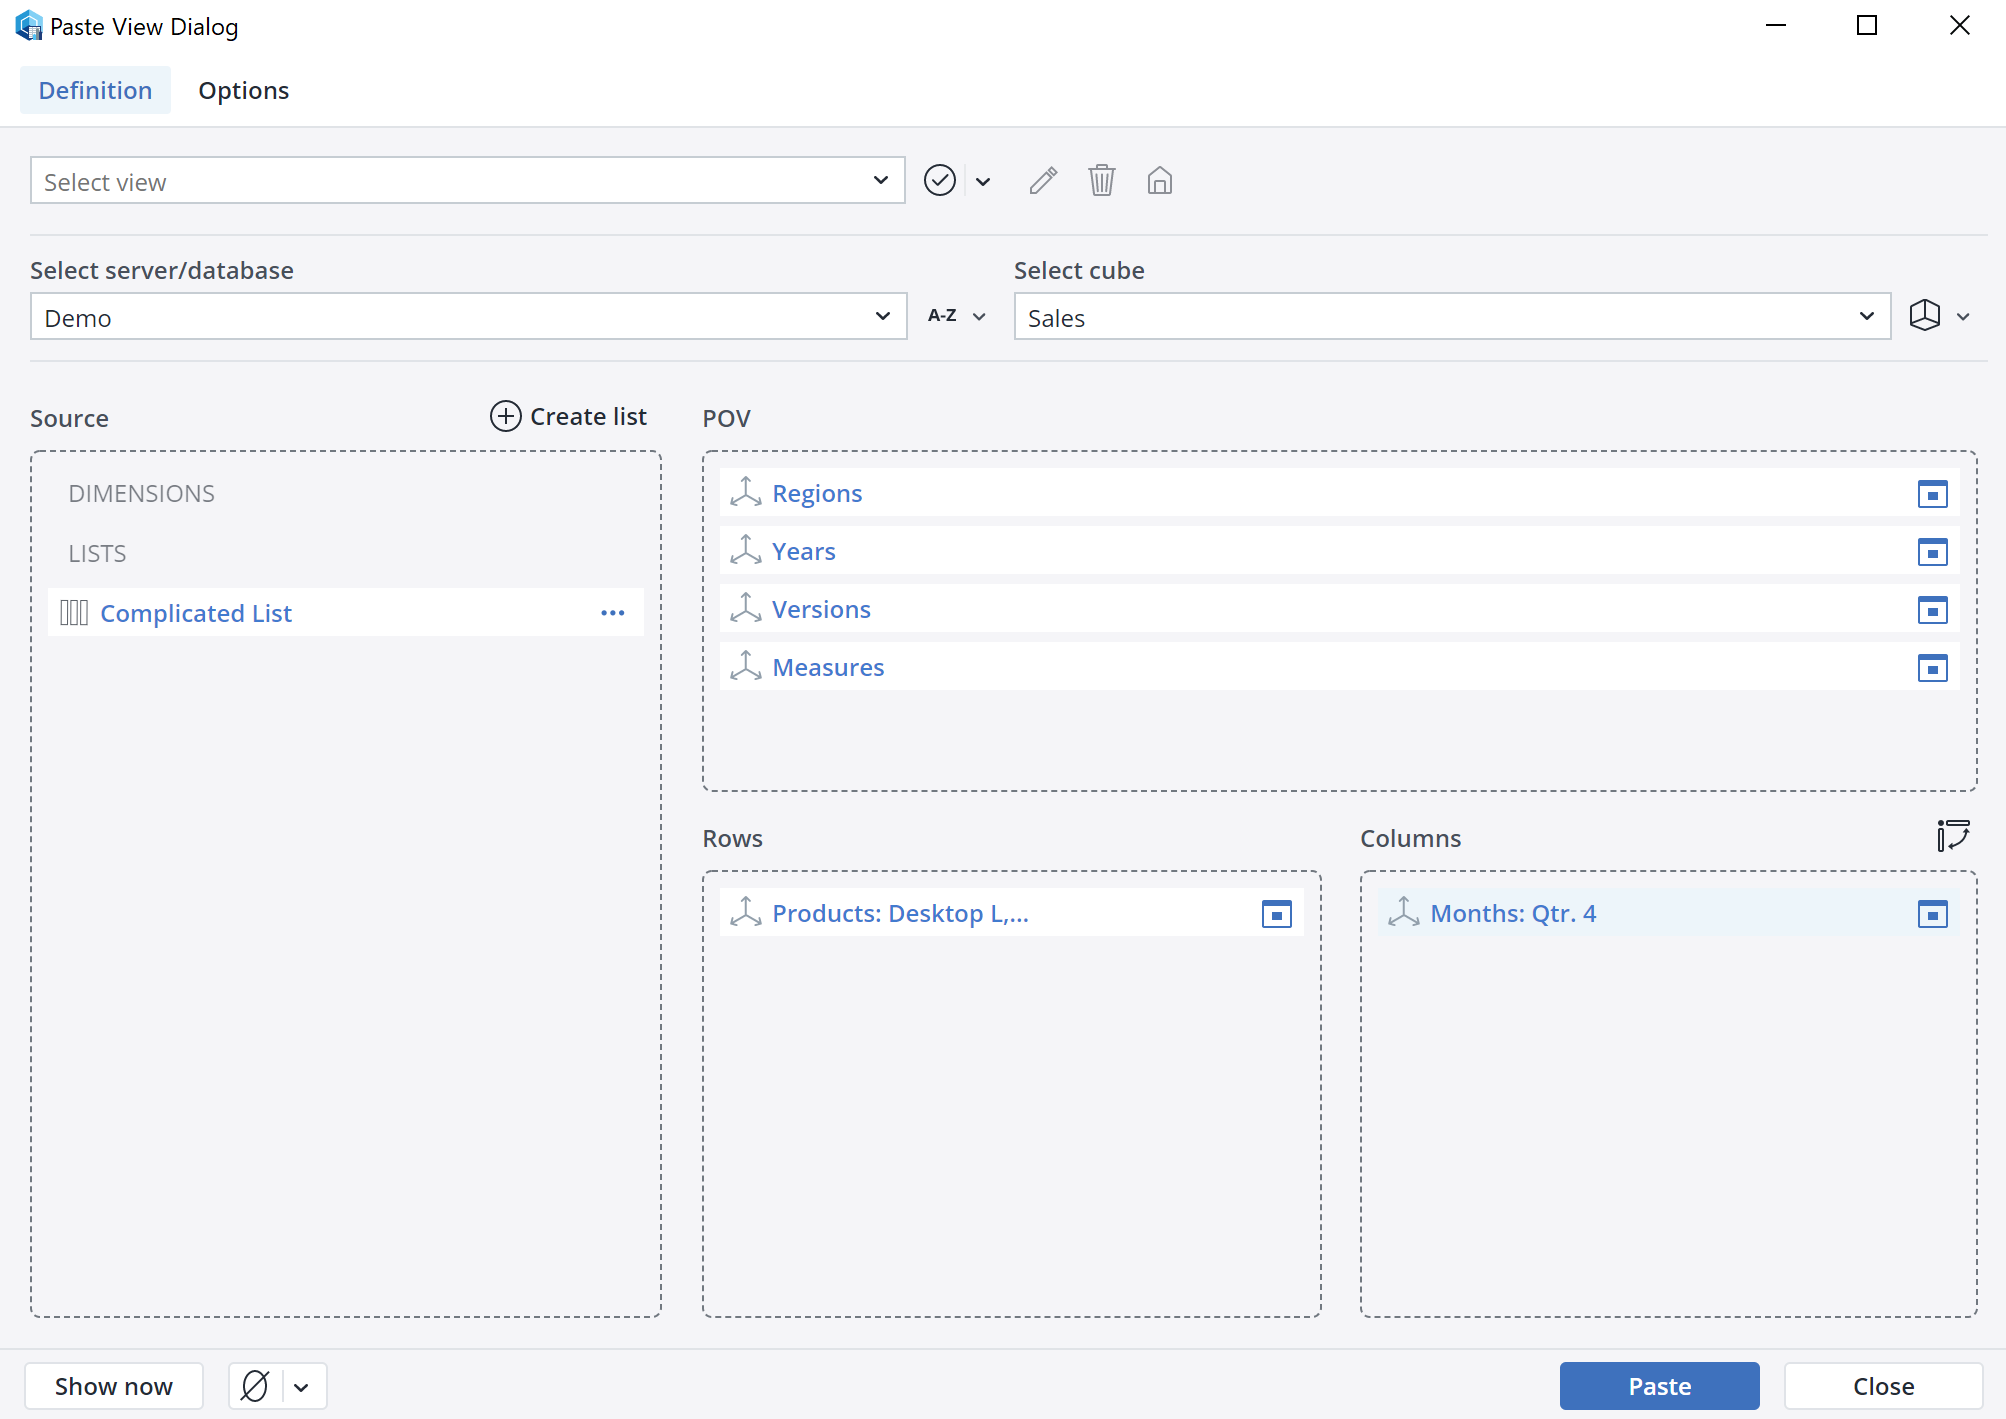
Select the basic elements of the Products dimension as row titles and "Qtr. 4" of the Months dimension as column title and then click Paste.
Double-click All Years and set the year 2014, then double-click Versions and set Actual, double-click Measures and set Turnover.
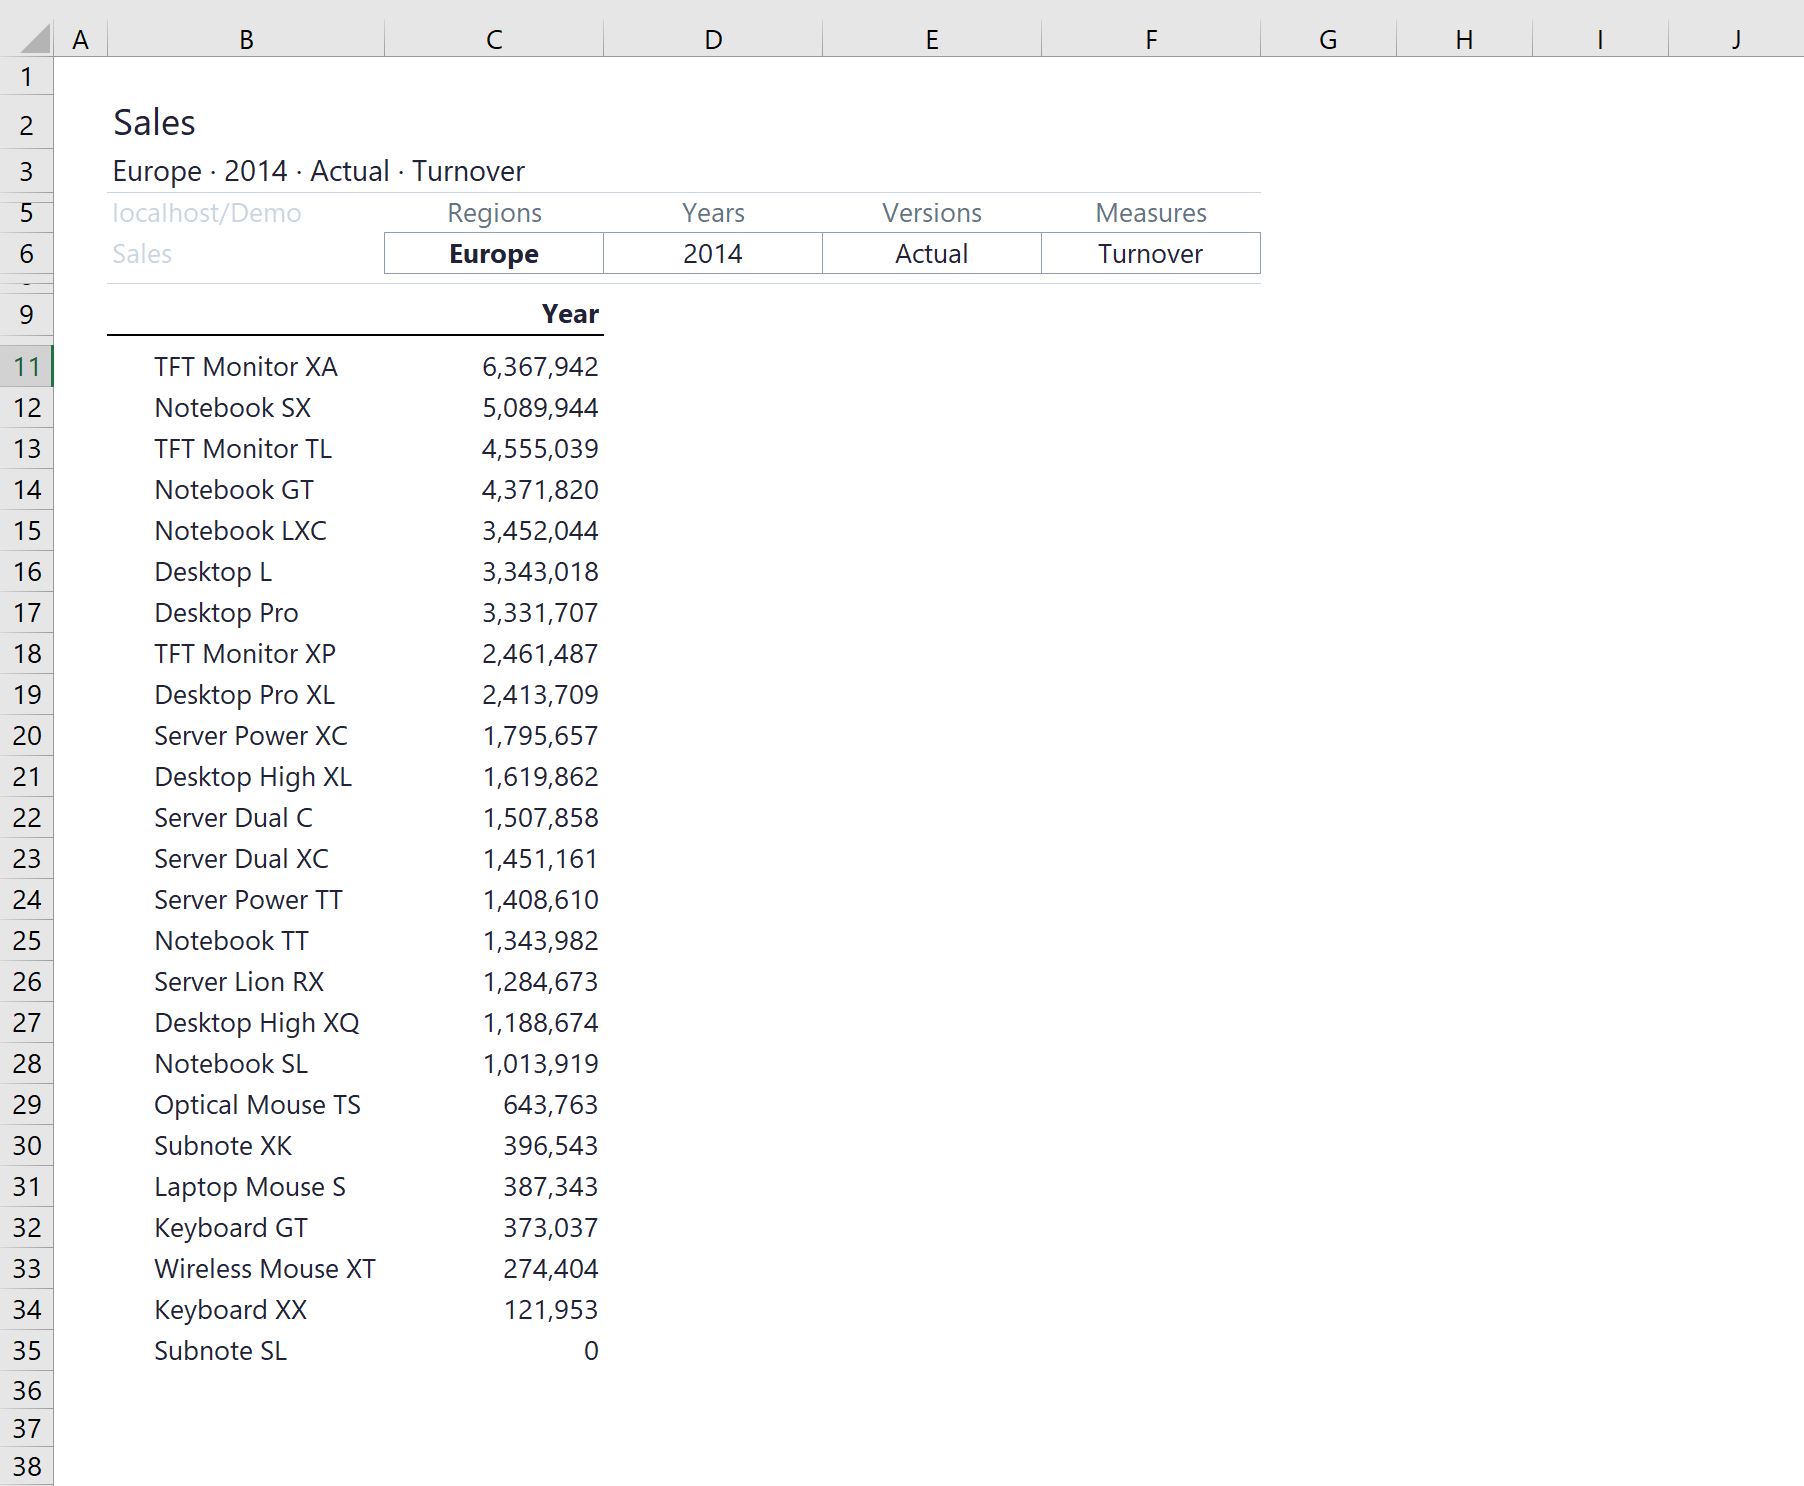
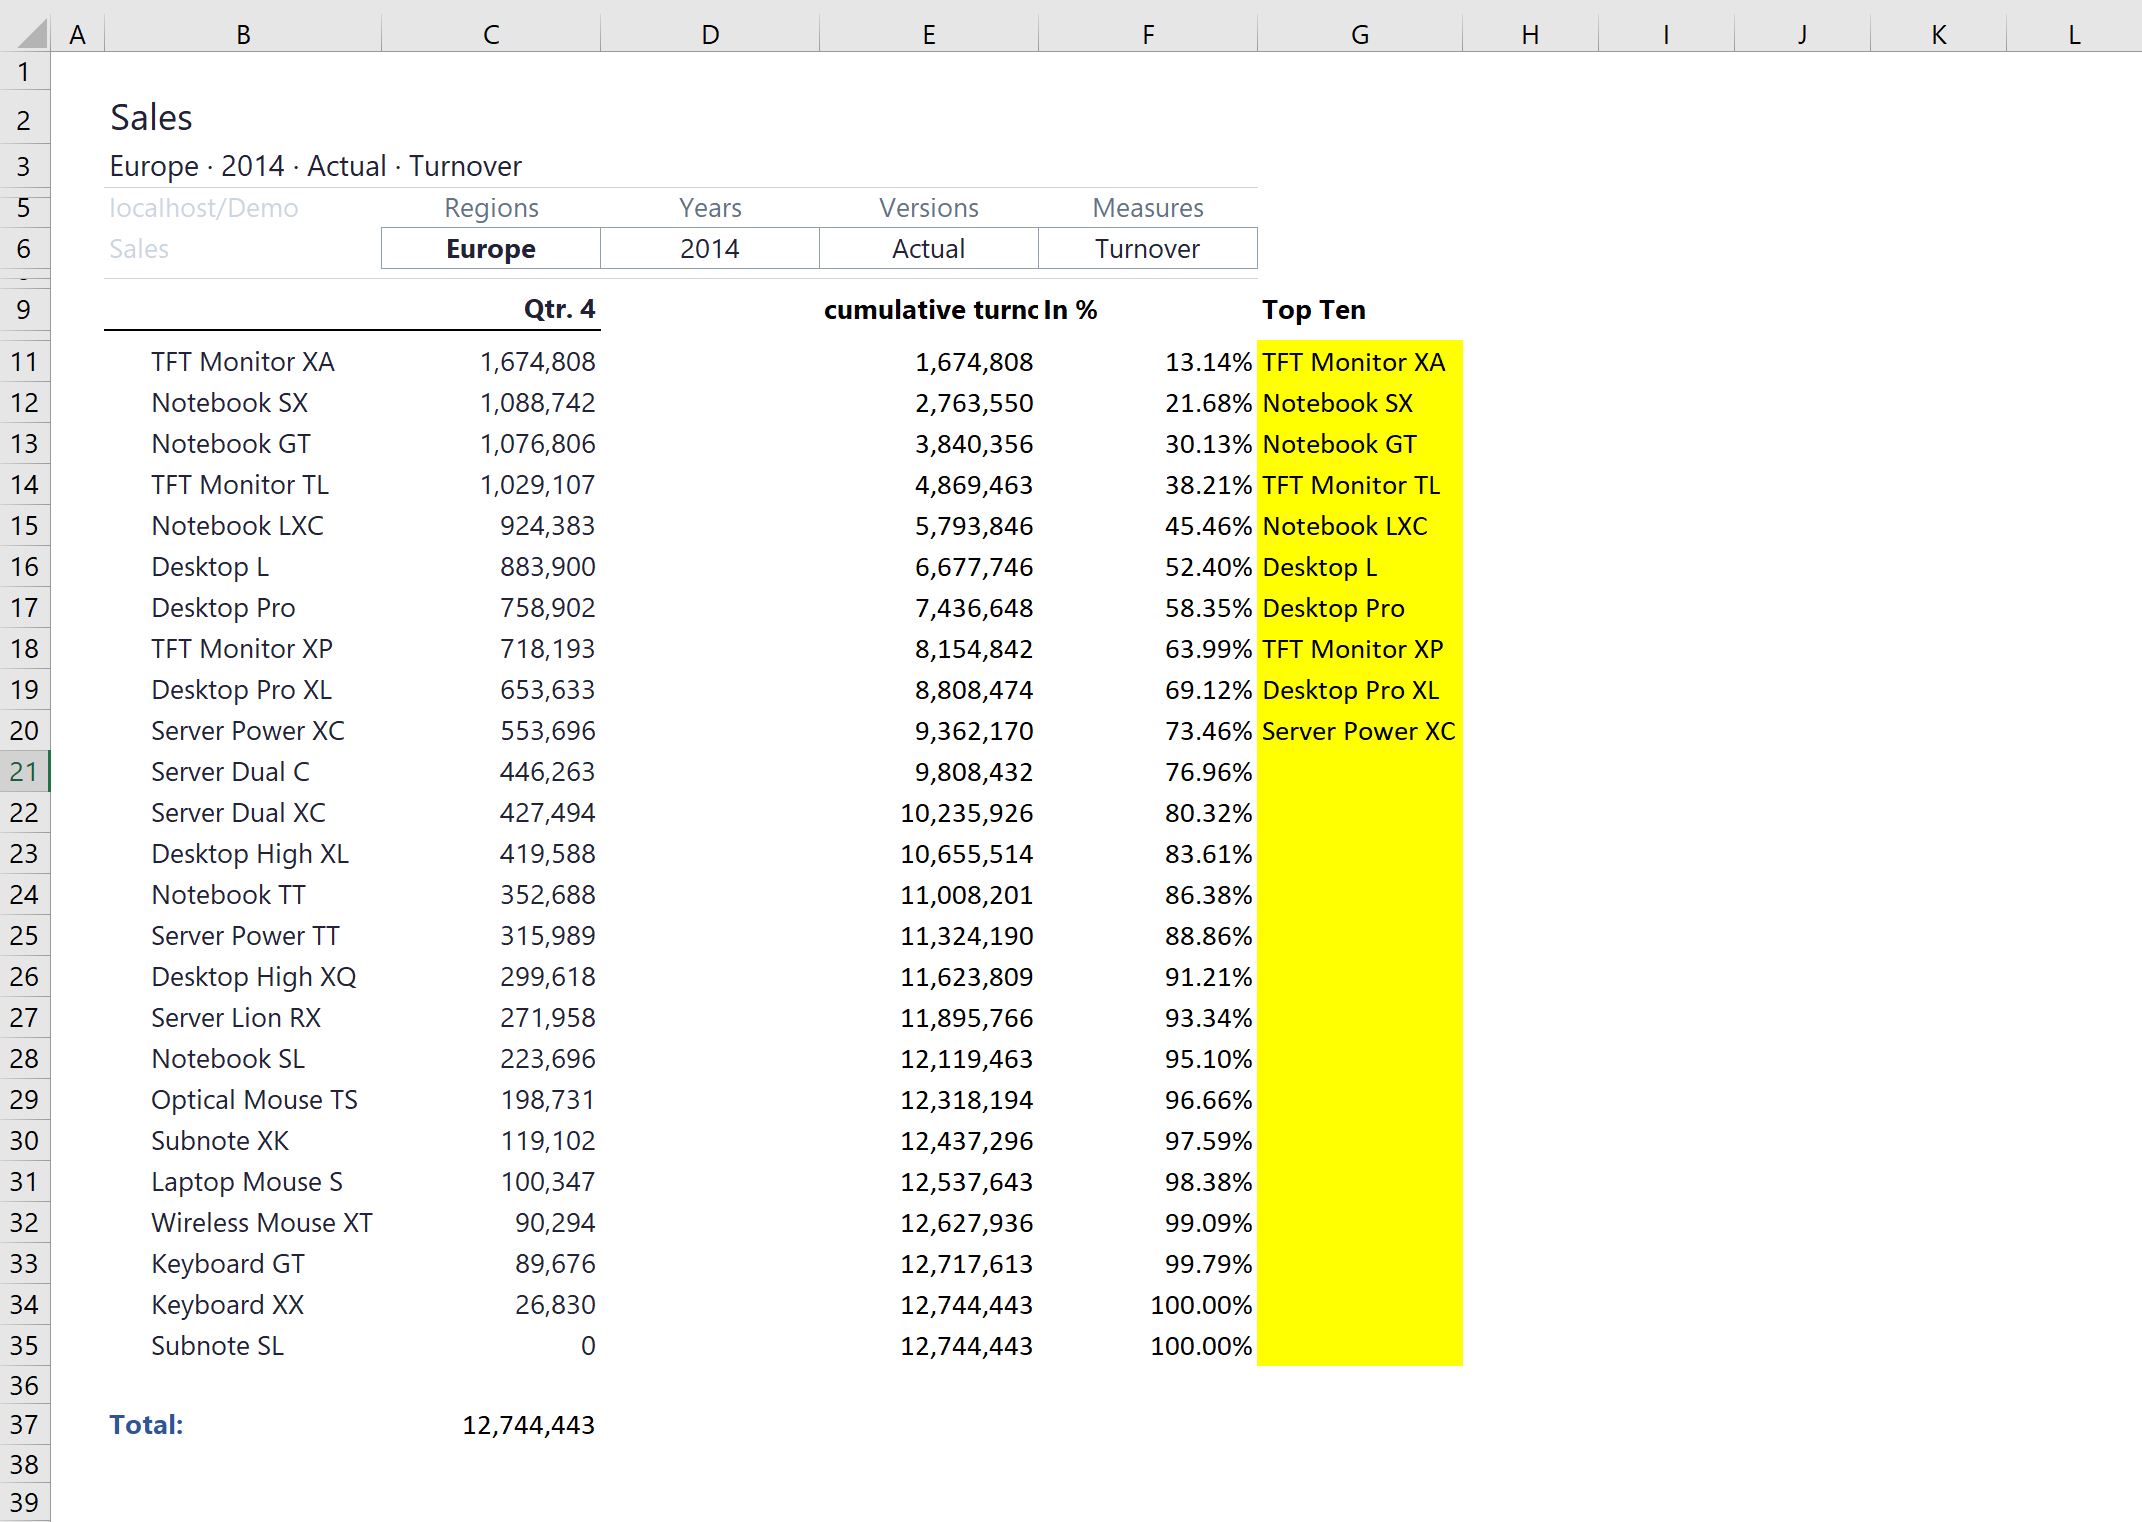
Then mark B11:C35 and sort these cells by Qtr.4 values descending. You will get the following view:
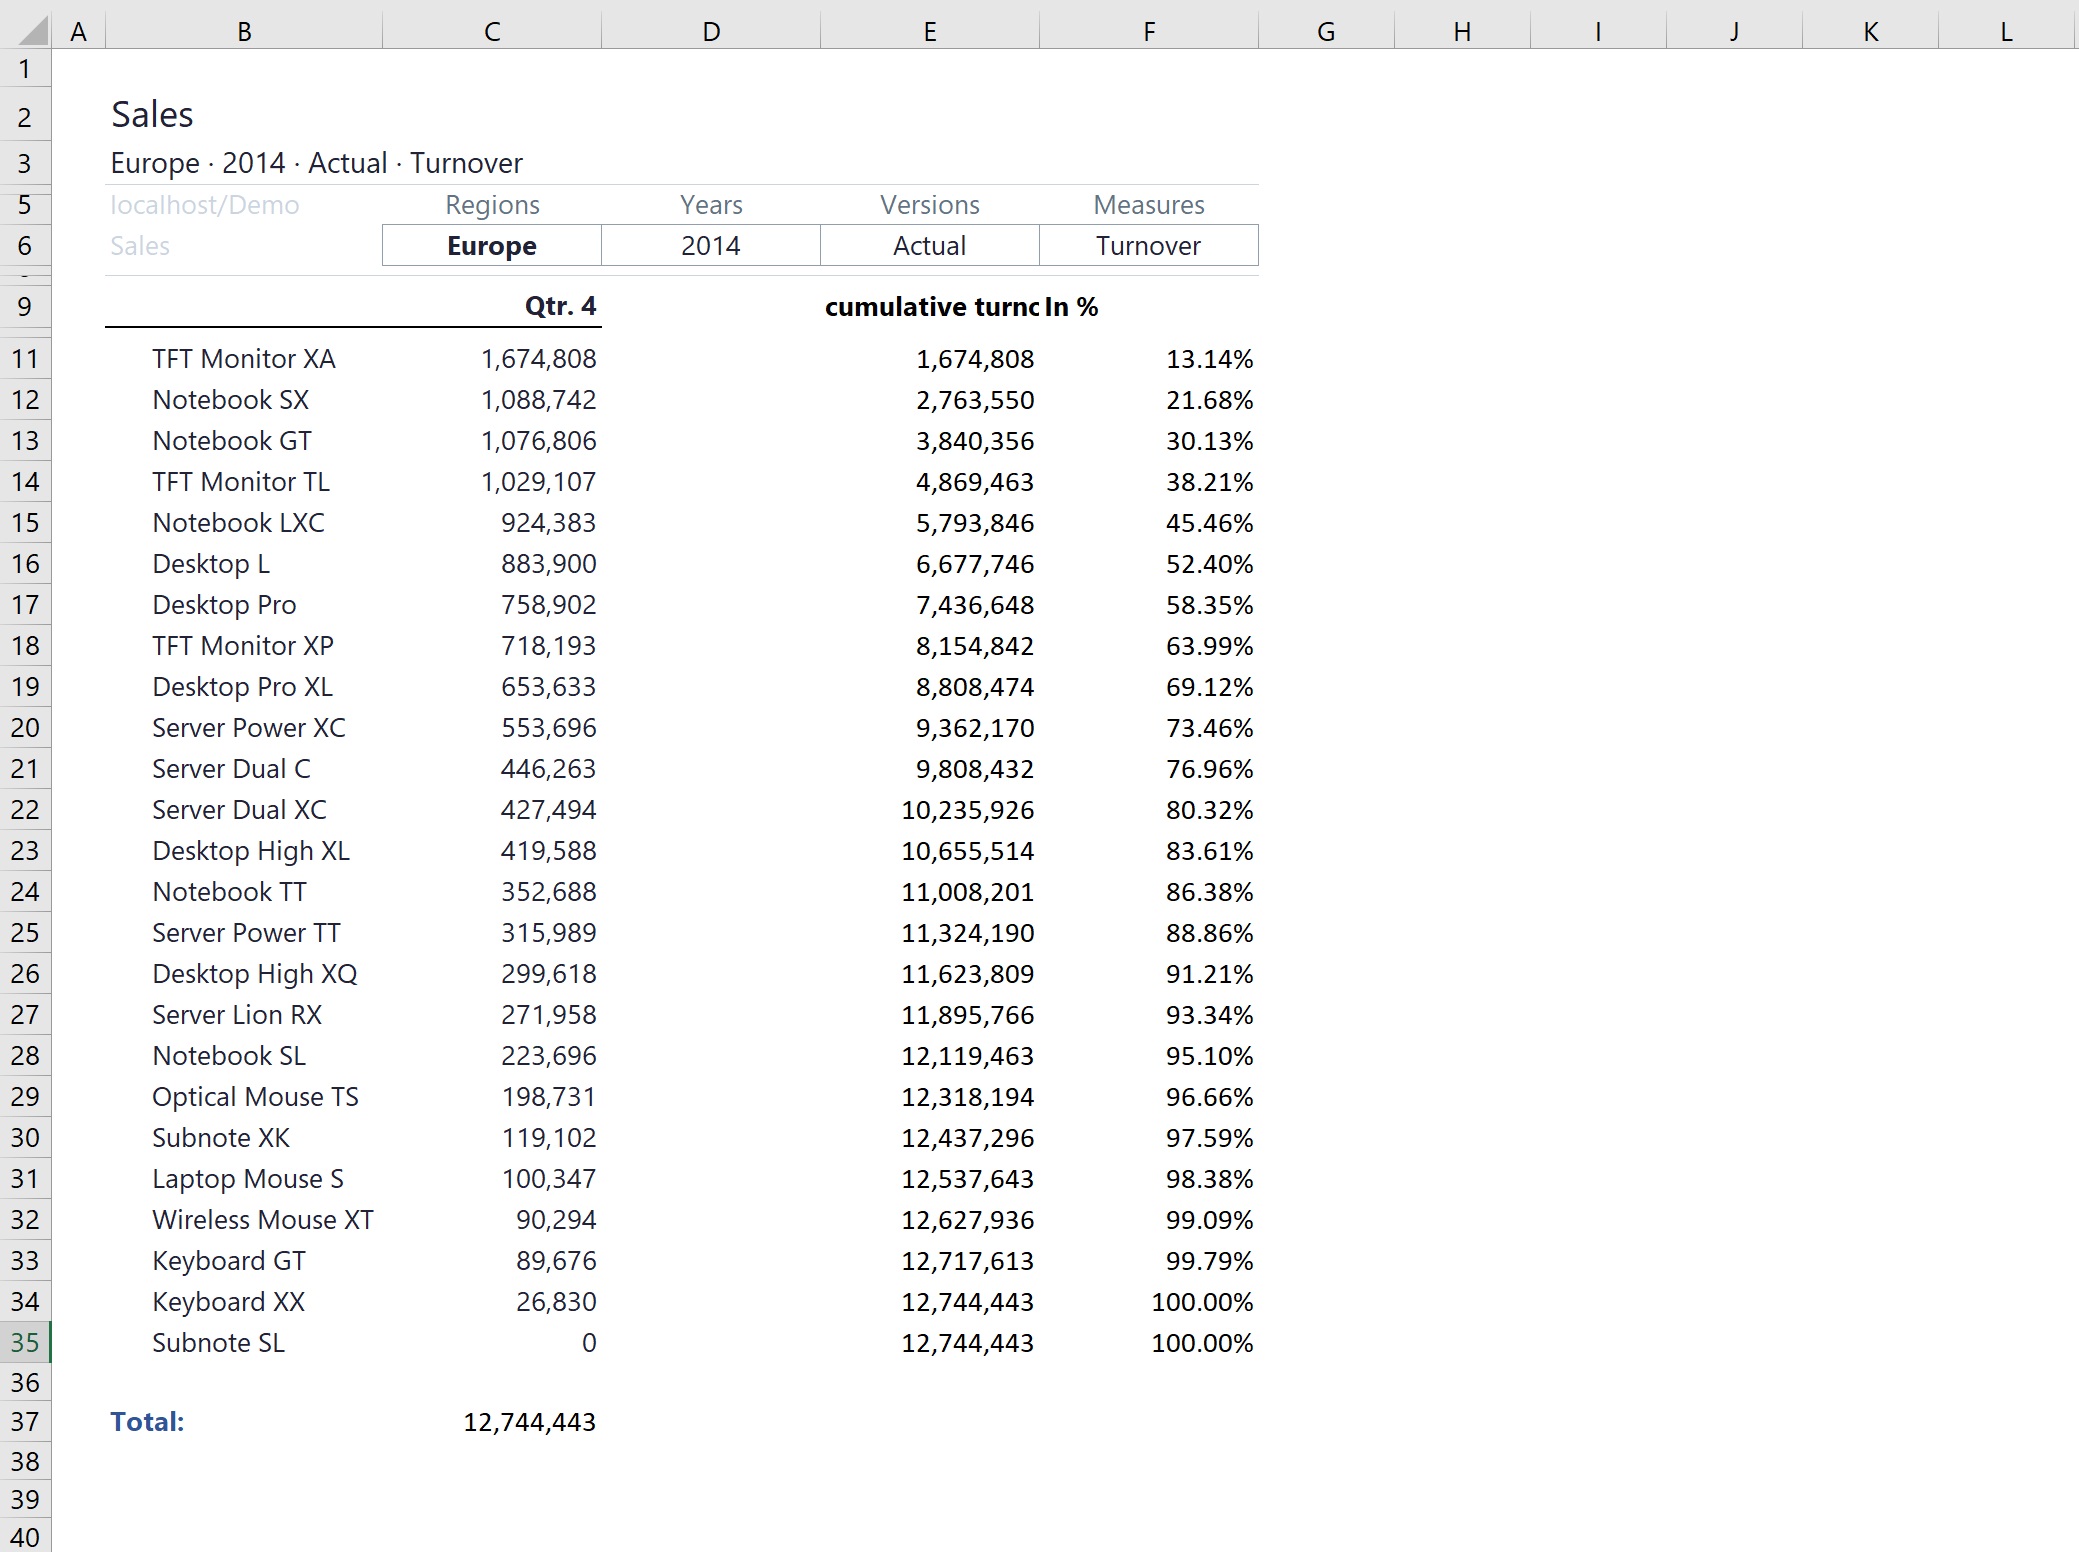
Next calculate the following cells: the total in C37, the cumulative turnover in column E, and their percentages in column F.
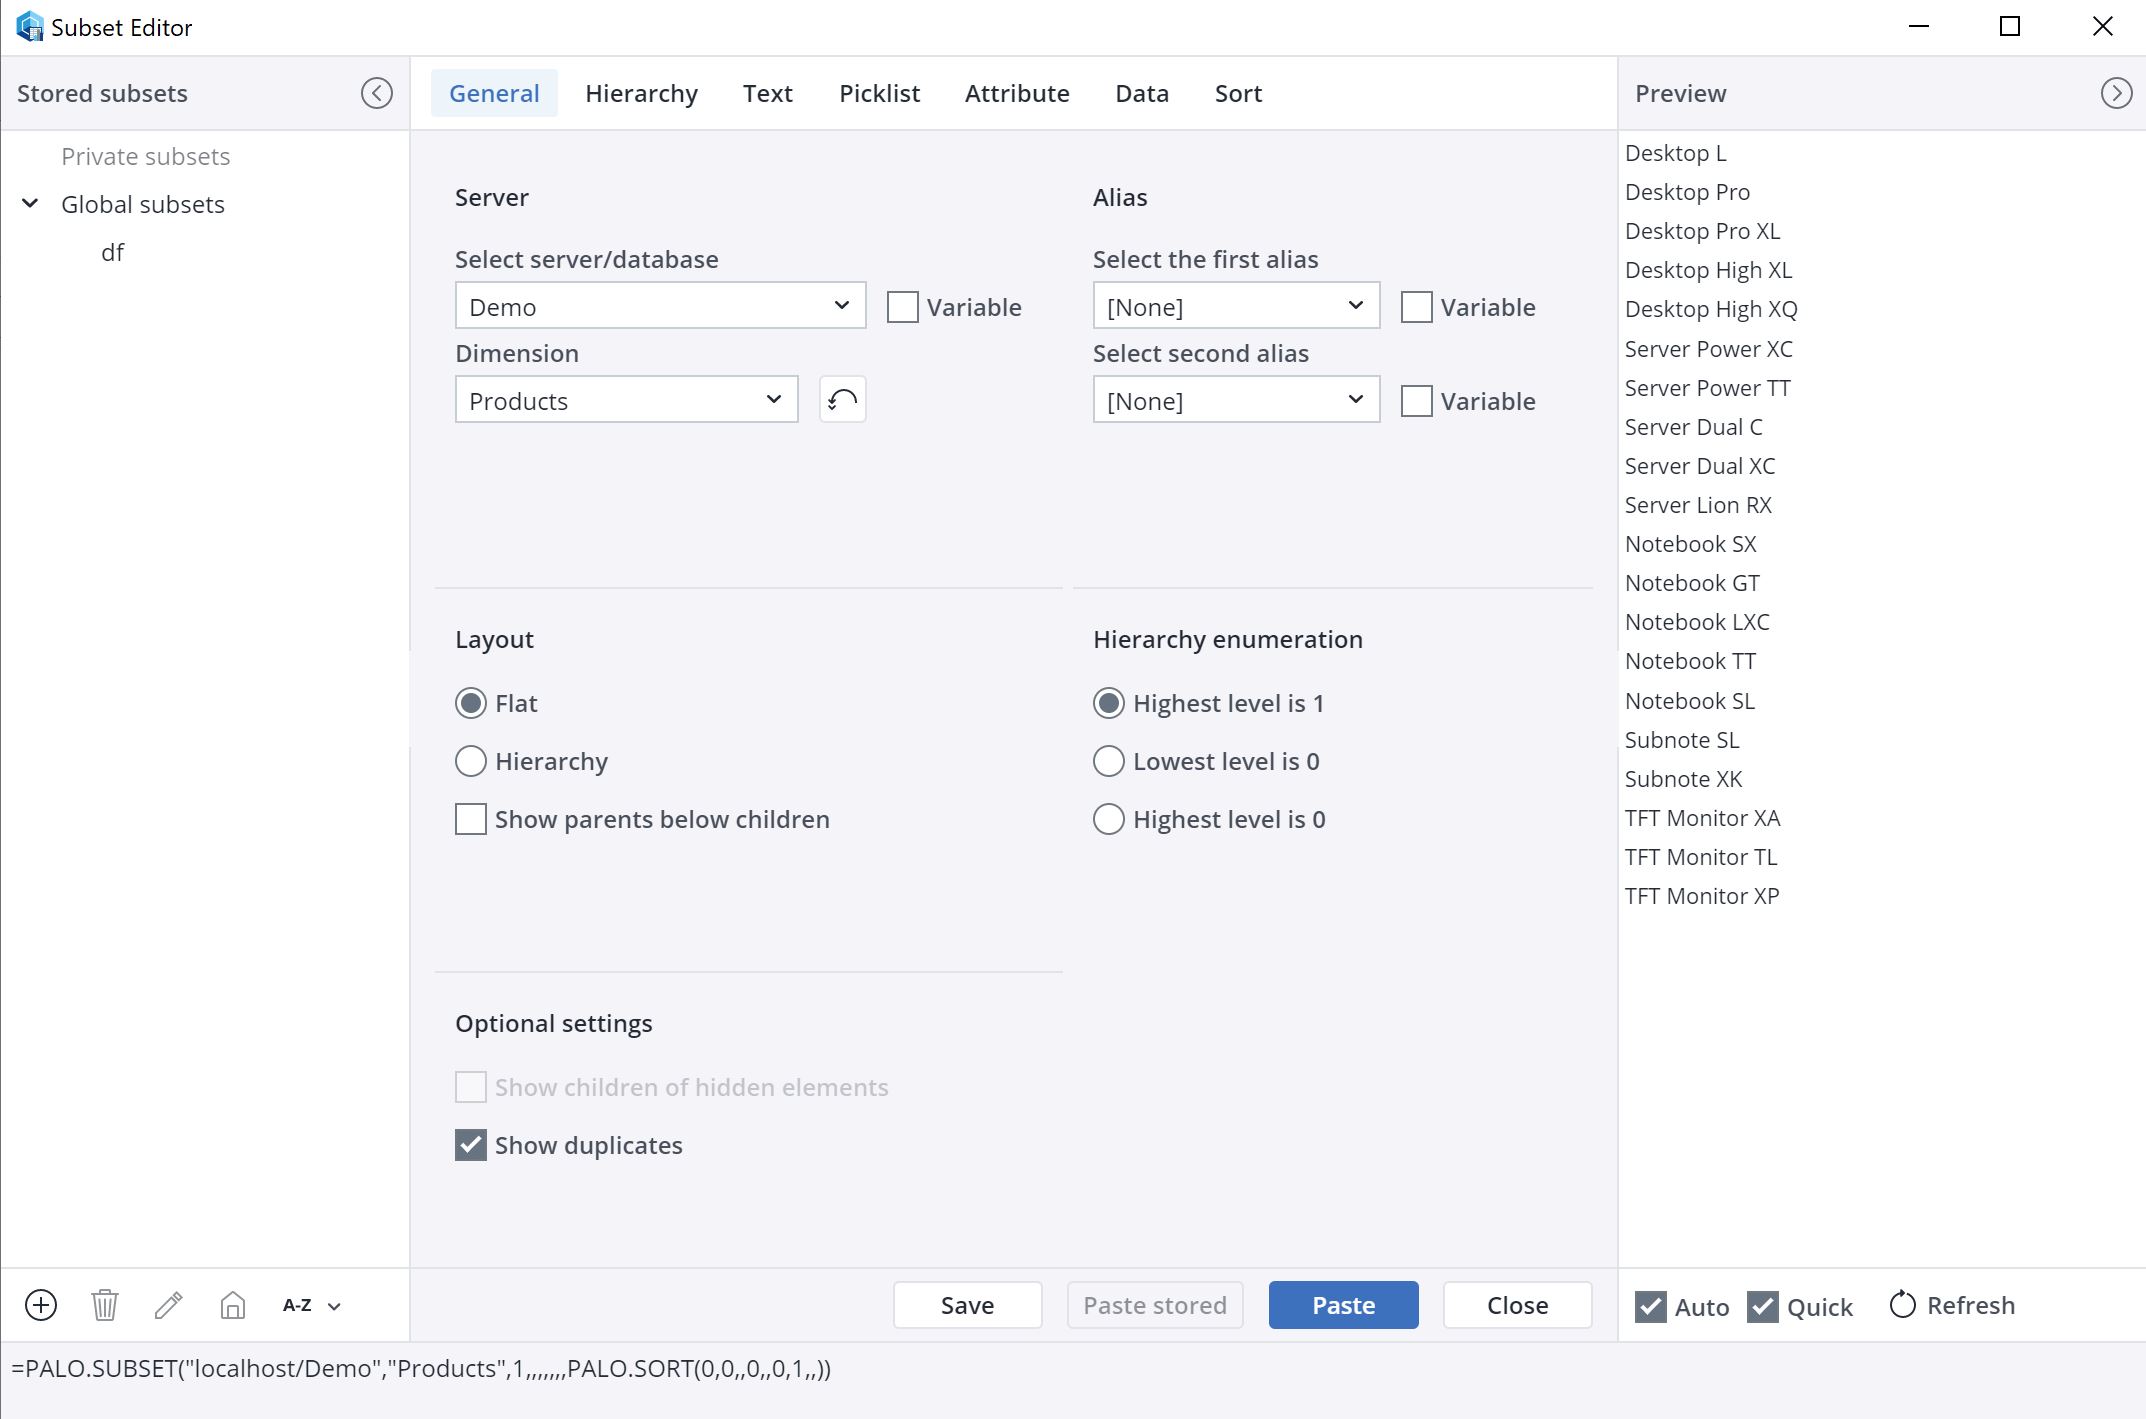
Then mark G11:G35 and open Paste Subset. Set the following options in the General tab:
- Server/Database Selection: Demo
- Dimension: Products
- Layout: Flat
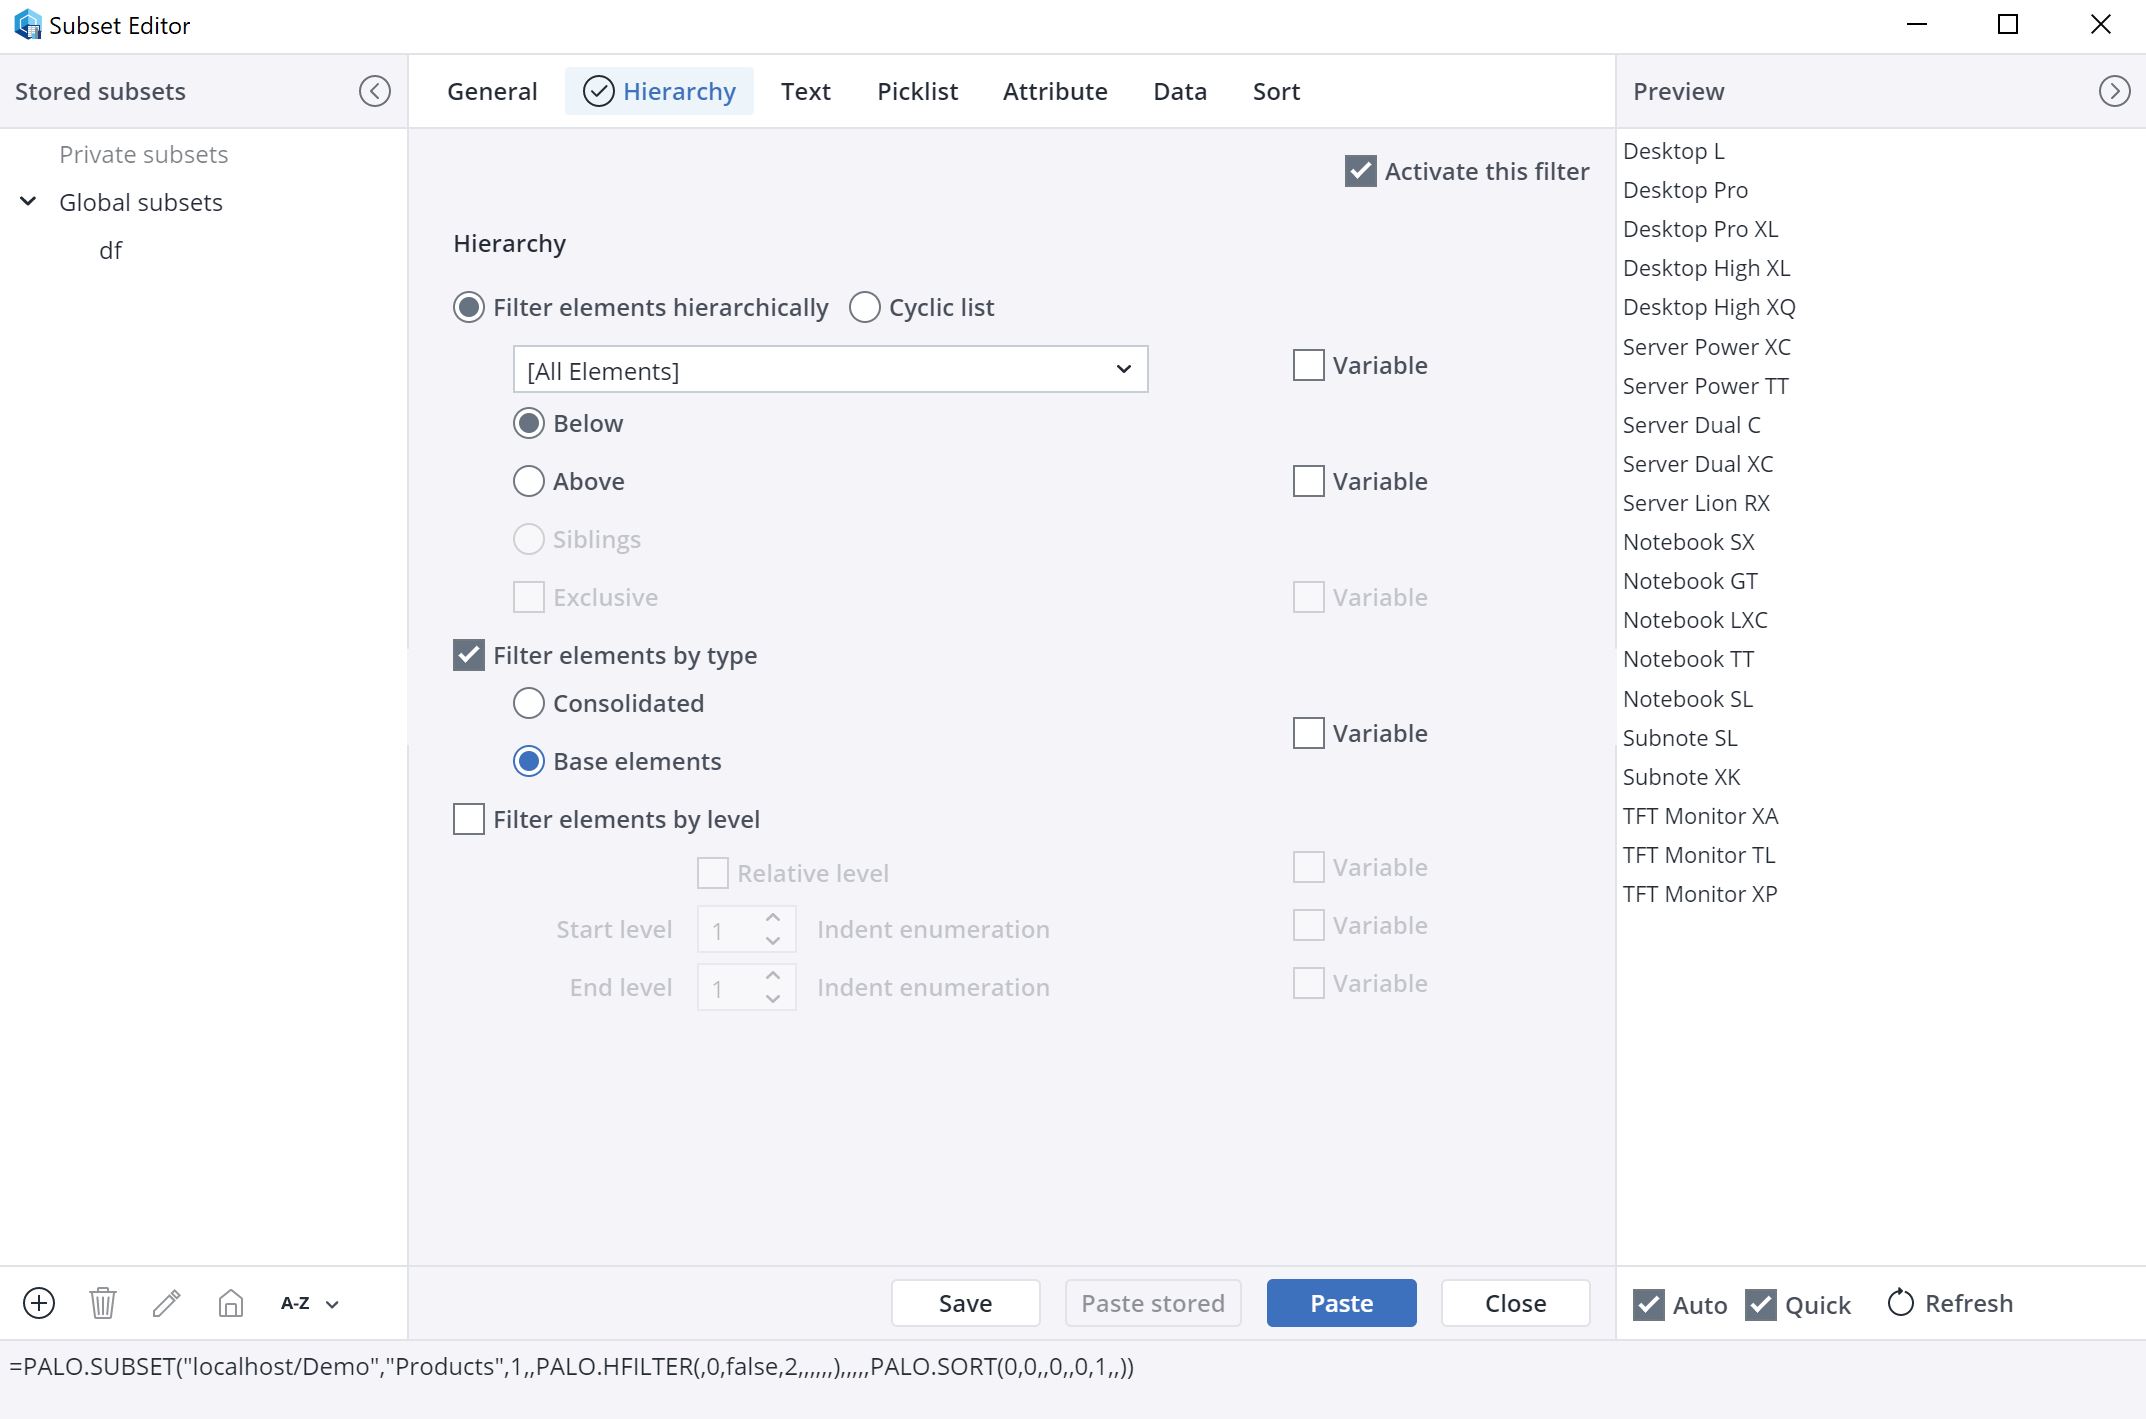
Make the following settings in the Hierarchy tab:
- Activate this filter
- Filter elements by type
- Base elements
Make the following settings in the Data tab:
- Activate this filter
- Select Cube : Sales
- Regions: Europe
- Months: Qtr. 4
- Years: 2014
- Version: Actual
- Measures: Turnover
- Criteria: The sum of the elements
- Take topmost elements: 10
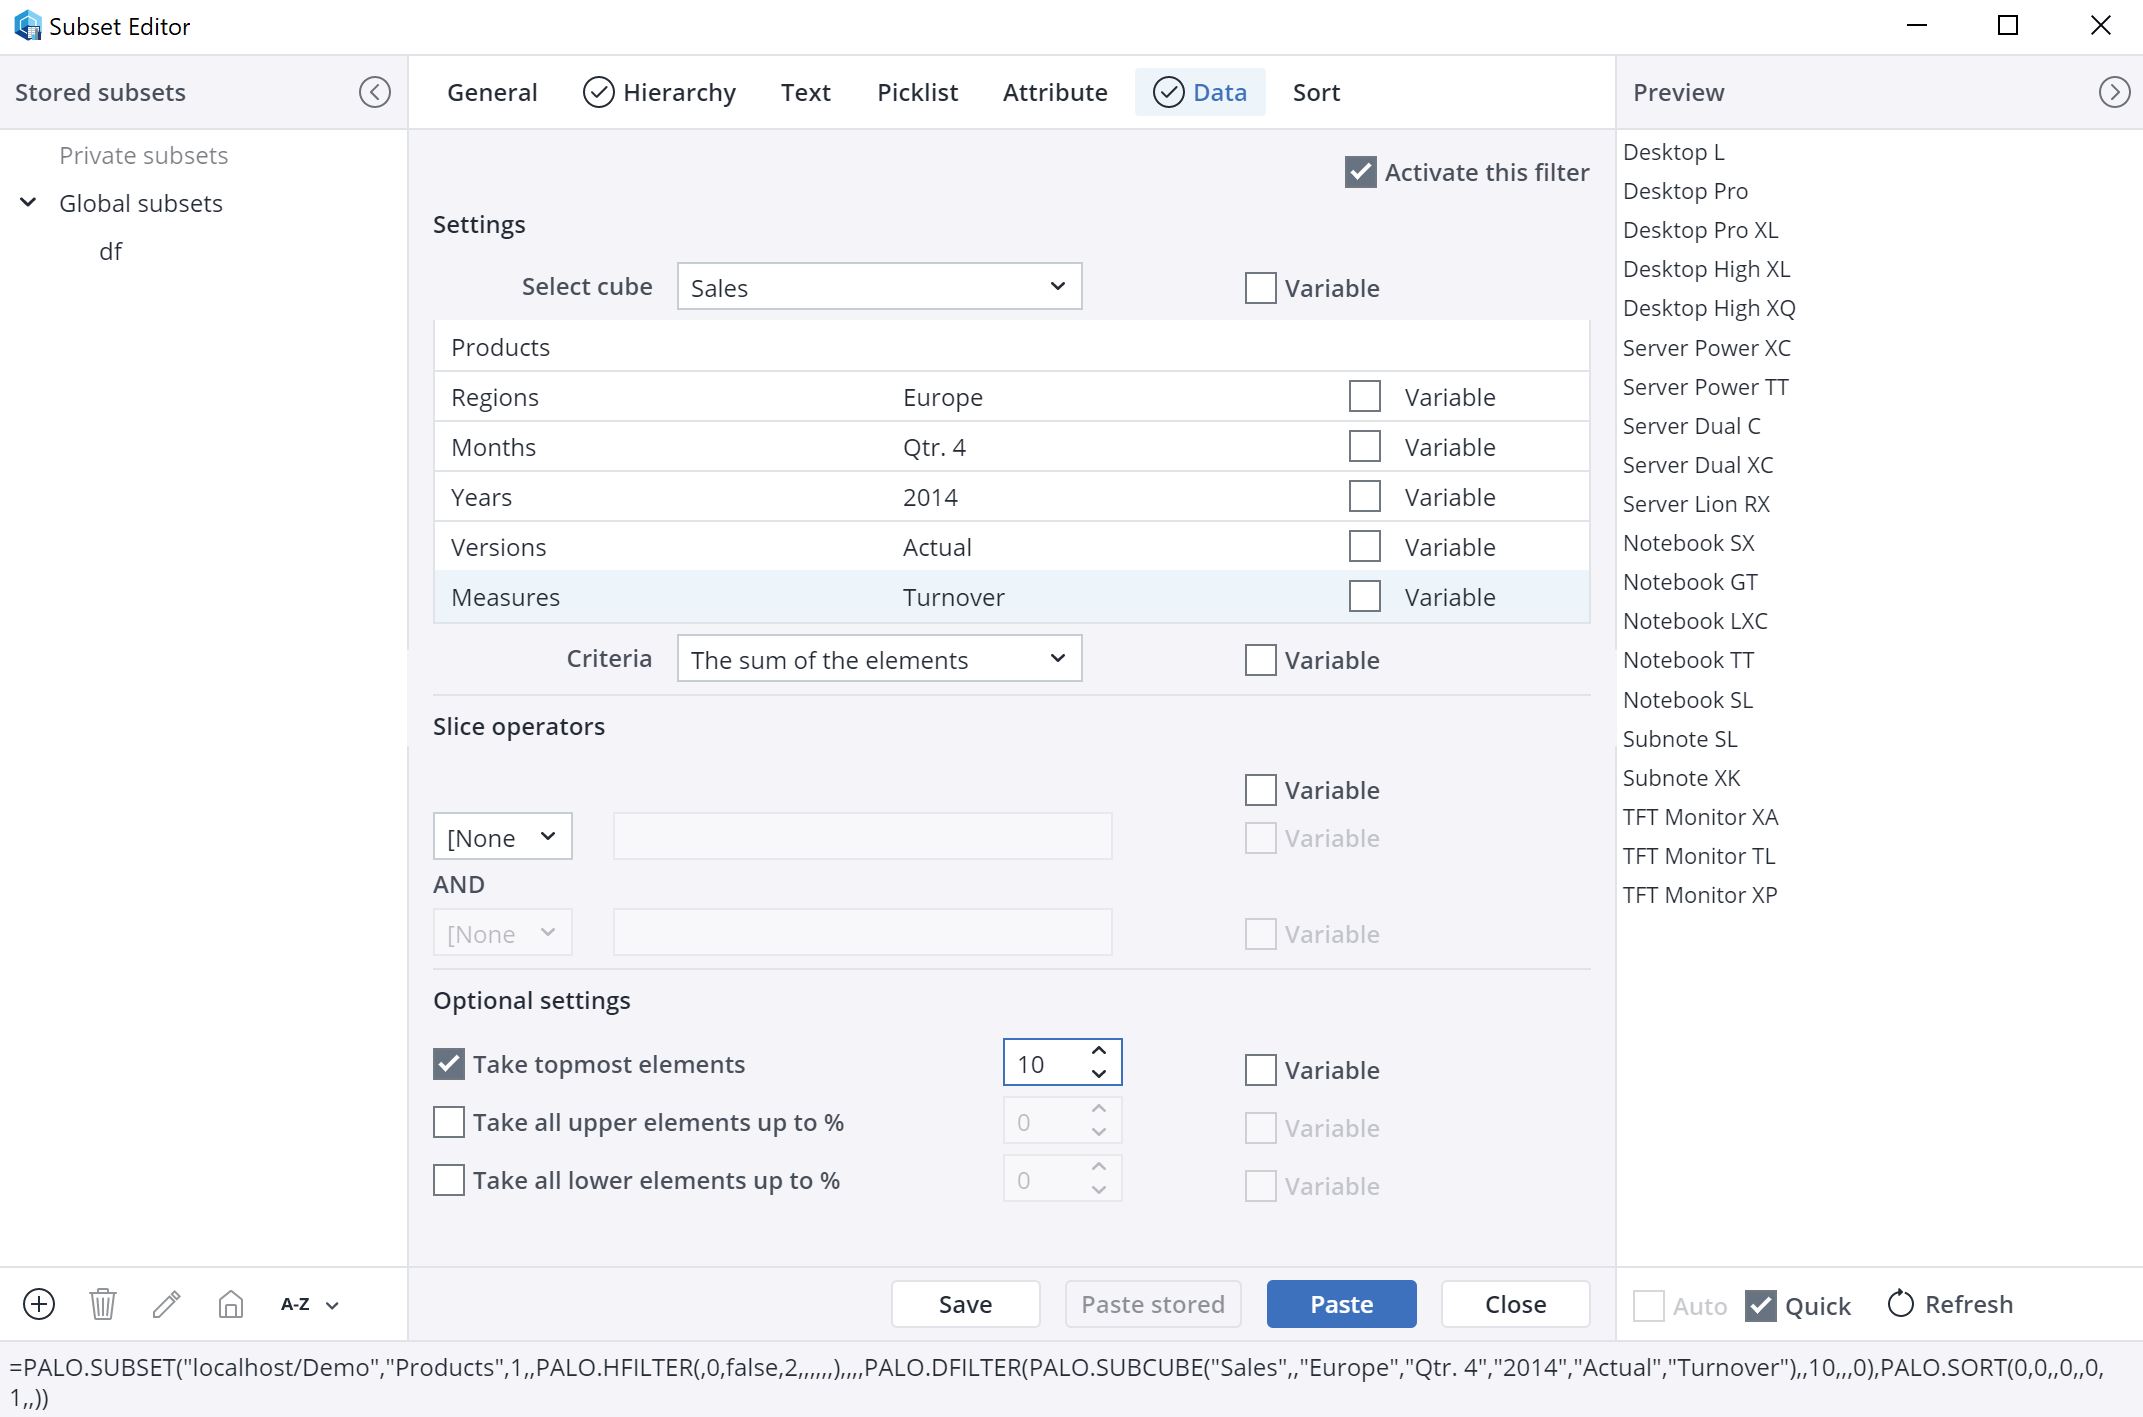
Note: the function PALO.DFILTER() requires a lot of computing power. Therefore, "Auto" preview is disabled by default when you activate this filter.
In the Sort tab, activate the following points:
- By Value
- Reverse
Click paste. The subset now shows the top ten elements in the control view (B7:B16).
The next article, Subset Example: ABC Analysis, builds on this example.
Updated July 21, 2025