This article provides an example of a dynamic report with a ComboBox and DynaRanges. For more information on these and other form elements, see the following articles:
Creating a ComboBox element
To create a new report with the ComboBox form element:
- In Designer, create the spreadsheet "Report 1".
- Double click on Report 1 and stay in cell A1. In the Insert tab, select the ComboBox element:

- The Format control dialog is displayed, prompting you to choose the settings for the ComboBox:
Note: there is a constraint for the data sources formula and ODBC query.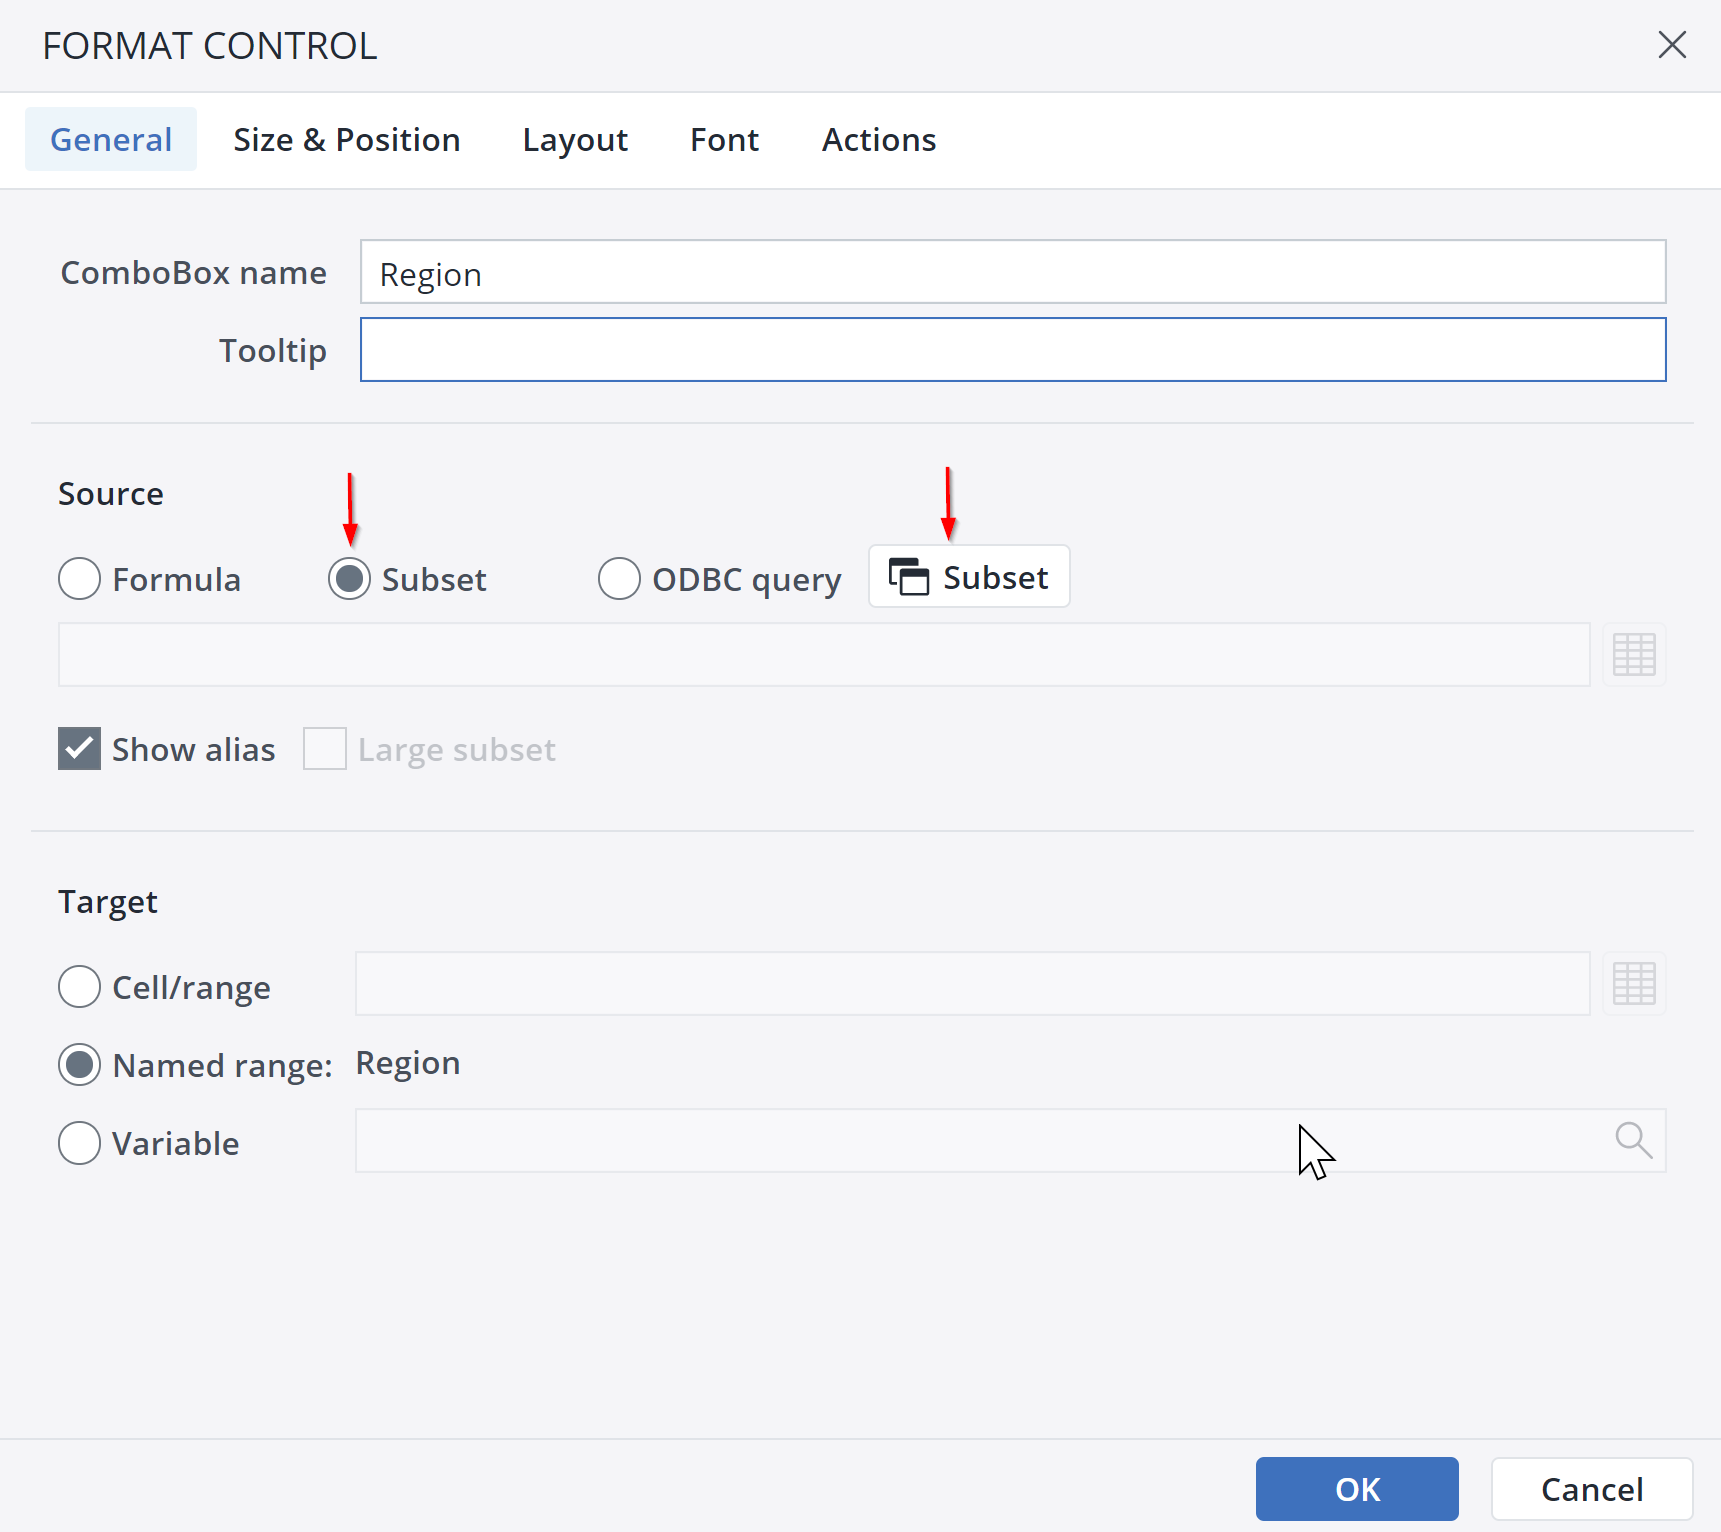
- Enter "Region" as the as the ComboBox name.
- Click on Subset to open the Subset Editor.
- On the General tab, select the server/database Demo and the dimension Regions.
- Activate the filter on the Hierarchy tab and check Filter elements by level. Select Start Level 1 and End Level 2.
- Click OK.
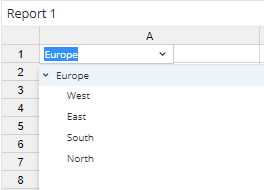
- Close the Format control dialog box by clicking OK. The following ComboBox appears:
Creating DynaRanges
To create DynaRanges, follow these steps:
- Highlight the cells D4:D6. In the Insert tab, select the Horizontal DynaRange icon.
- As source, use a subset of the database Demo with the second hierarchy level of the Years dimension.
- Highlight C5:E5 and select the Vertical DynaRange icon from the Insert tab.
- Select Subset as a source.
- On the General tab, select the Demo database and the dimension Regions.
- On the Hierarchy tab, check box to activate the filter as well as the top Variable box:
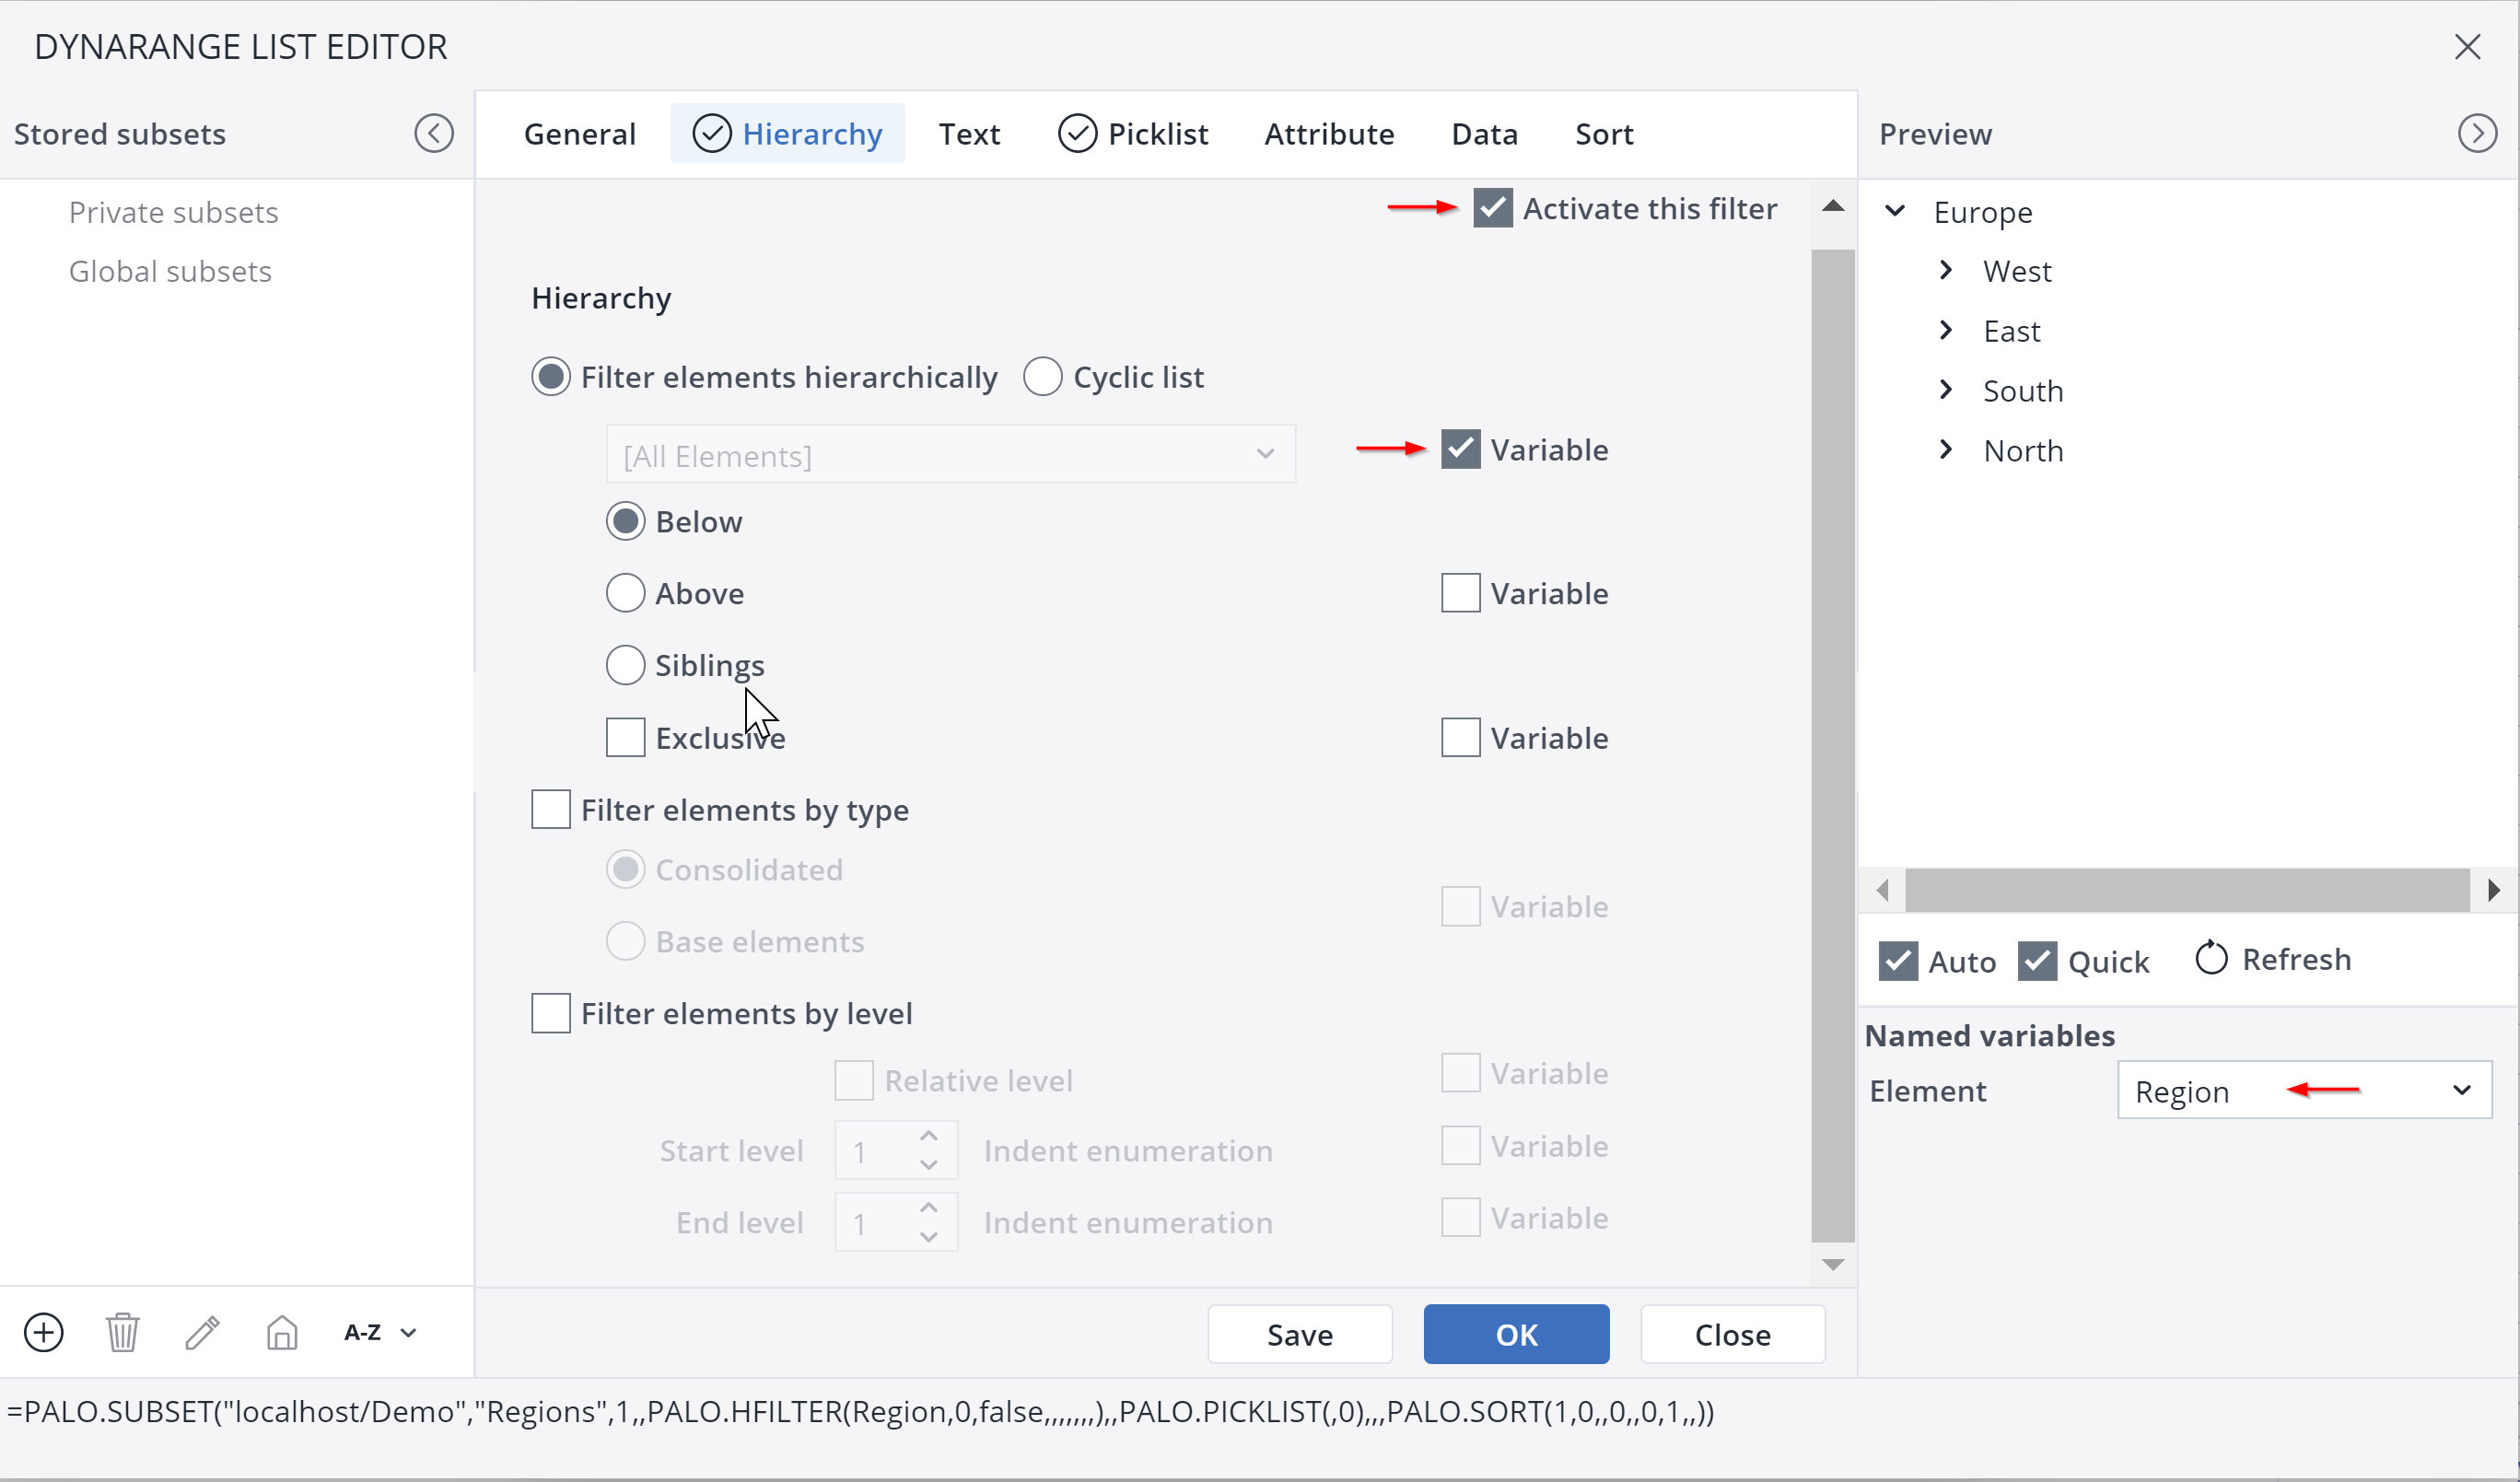
- Select Region as variable.
Add a PALO.DATA function in D5:
- Select Query > Paste Data Function…
- In the dialog box, select the database and the cube and check Guess Arguments. Click Paste:
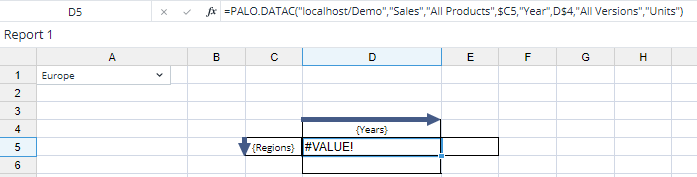
The entry in D5 should be
=PALO.DATA("localhost/Demo","Sales","All Products",$C5,"Year",D$4,"All Versions","Units") resp. same with PALO.DATAC. - Right-click D5 and select Format cells from the context menu.
- Set the number format to 0 decimal places and click OK.
On the Design tab, click the Designer preview icon ![]() to see the result:
to see the result:
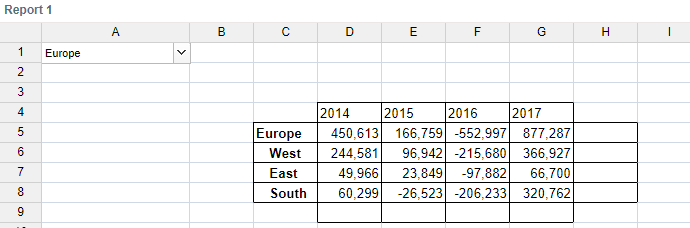
For performance reasons, a maximum of four elements will appear for each dimension in Designer preview.
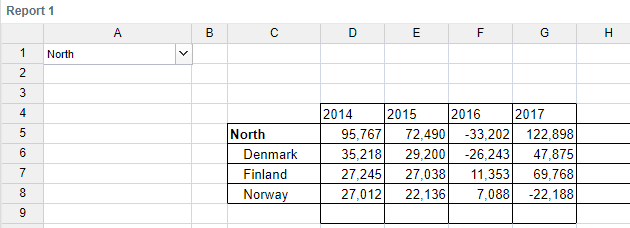
The Region ComboBox will now allow you to select each sub-region.
For example, by selecting "North", it will look like this:
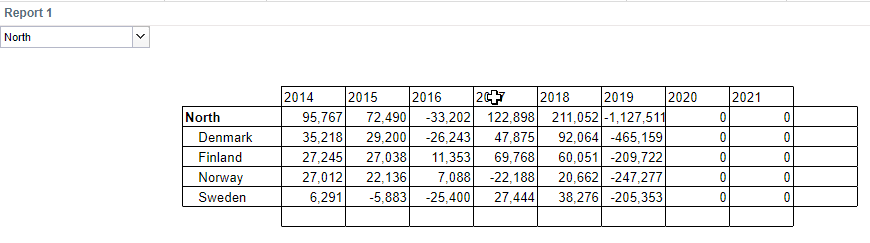
To see a full view of all the data close Designer preview and click the Open user mode icon ![]() :
:
Updated July 3, 2025