This article provides an example of a dynamic report with two ComboBoxes and two interdependent vertical DynaRanges, first as outer and second as inner DynaRange. In the example are displayed all customers who have nothing ordered in a certain year and in a certain region.
For more information on these and other form elements, see the following articles:
Creating two ComboBoxes
To create a new report with the first ComboBox form element:
- In Designer, create the spreadsheet "Nested_Dynaranges".
- Double click on Nested_Dynaranges and stay in cell A1. Enter „Year“ and go to A2. In the Insert tab, select the ComboBox element:

- The Format control dialog is displayed, prompting you to choose the settings for the ComboBox:
Note: there is a constraint for the data sources formula and ODBC query.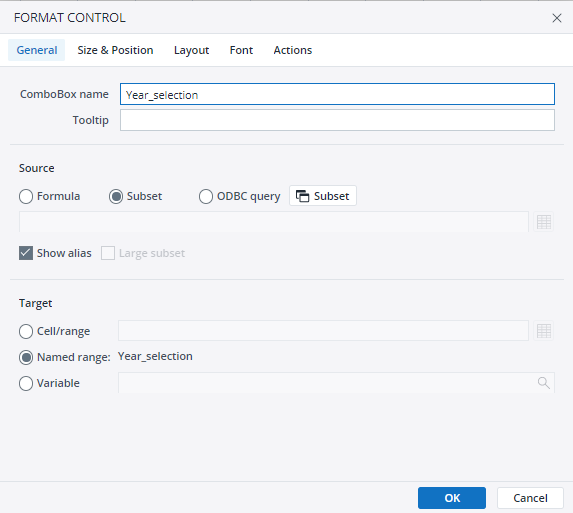
- Enter “Year_selection” as the ComboBox name.
- Click on Subset to open the Subset Editor.
- On the General tab, select the server/database Biker and the dimension Years.
- Activate the filter on the Hierarchy tab and check Filter elements by level. Select Start level 2 and End level 2.
- Click OK.
- Close the Format control dialog box by clicking OK. The following ComboBox appears:
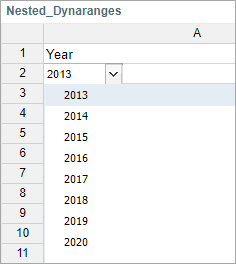
- Go to B1 and enter "Region".
- Go to B2. In the Insert tab, select the ComboBox element:
- The Format control dialog is displayed, prompting you to choose the settings for the ComboBox:
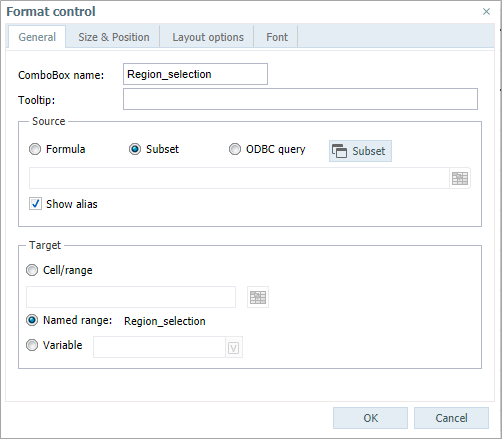
- Enter “Region_selection” as the ComboBox name.
- Click on Subset to open the Subset Editor.
- On the General tab, select the server/database Biker and the dimension Customers.
- Activate the filter on the Hierarchy tab and check Filter elements by level.
Select Start level 2 and End level 2. - Click OK.
- Close the Format control dialog box by clicking OK. The following ComboBox appears:
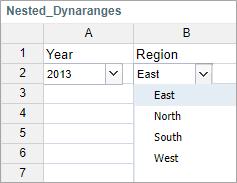
Creating two nested interdependent vertical DynaRanges
To create the outer DynaRange, follow these steps:
- Highlight the cells D3:G5. In the Insert tab, select the Vertical DynaRange icon:
You receive:
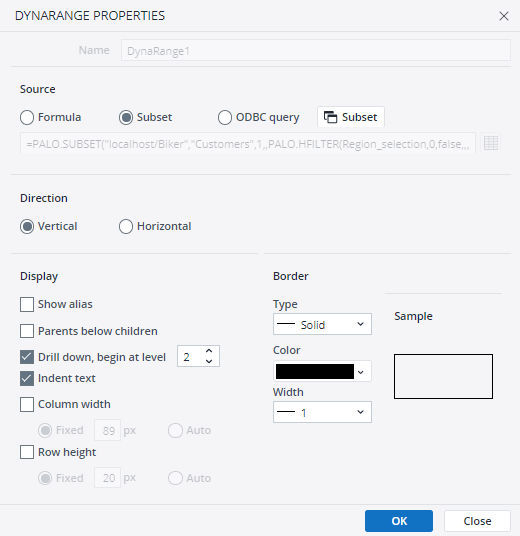
- As source, use a subset of the dimension Customers and select the following settings in Hierarchy tab:
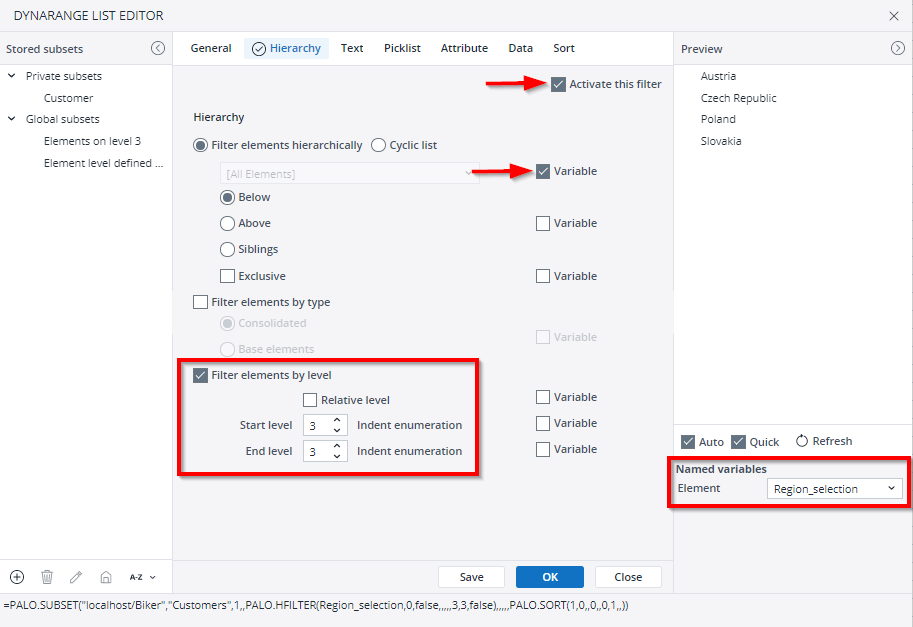
Relative level should not be checked! - Select Region_selection as variable.
To create the inner DynaRange, follow these steps:
- Highlight the cells E4:F4. In the Insert tab, select the Vertical DynaRange.
- As source, use a subset of the dimension Customers and select the following settings in Hierarchy tab:
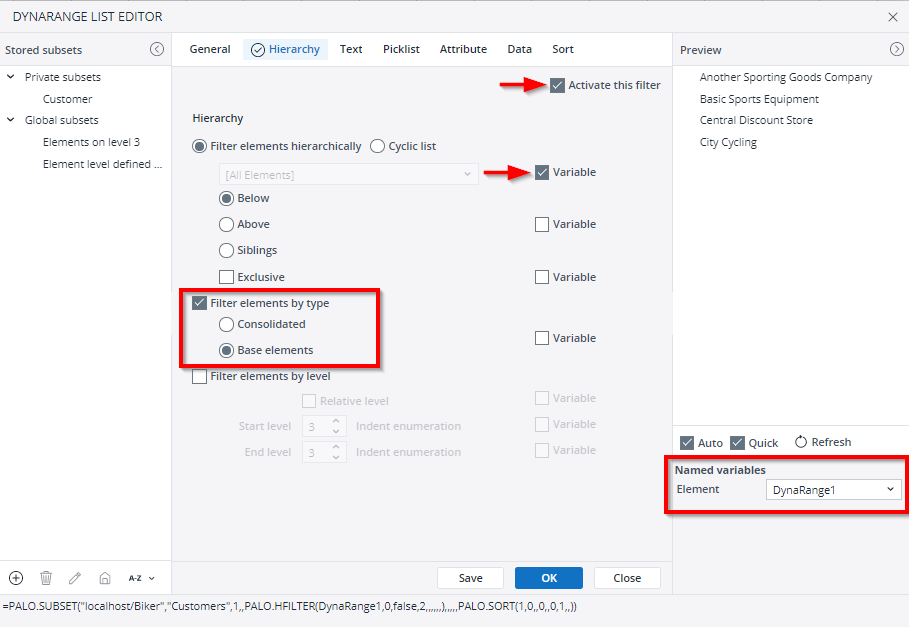
- Select Dynarange1 as variable.
Note: When referring from the formula of the dependent DynaRange to its “parent”, you have to use the parent’s name (for example, “DynaRange1”), not a cell reference. Cell references in DynaRange source formulas are static, meaning they are not rewritten as the DynaRange expands. - To display only the customers with 0 orders we select the Data tab and set the following settings:
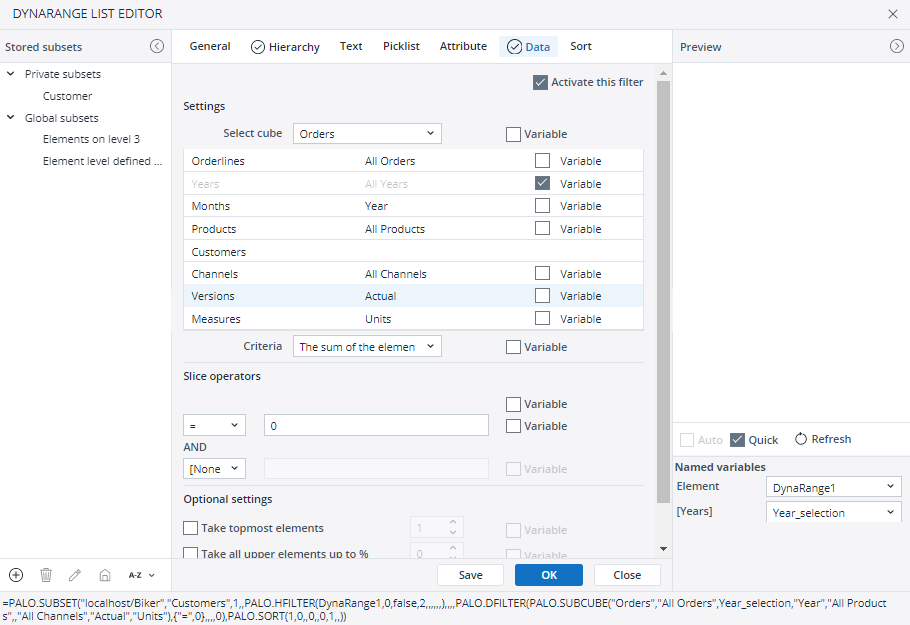
Select cube: Orders Months: Year Channels: All Channels Orderlines: All Orders Products: All Products Versions: Actual Years: Variable „Year_selection“ Customers: nothing (here will be displayed the dimension elements which match the criteria) Measures: Units
Criteria: The sum of the elements
Slice operators: = 0
We close the open dialogs with „OK“ and receive the following entries in the spreadsheet: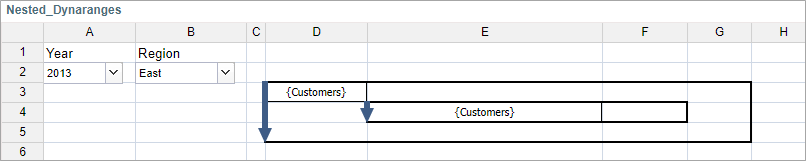
Add a PALO.DATA function in F4:
- Select Query > Paste Data Function…
- In the dialog box, select the server/database Biker and the cube Orders. Then check Guess Arguments. Click Paste.
- The guessed formula is:
=PALO.DATAC("localhost/Biker","Orders","All Orders",Year_selection,"Year","All Products",$E4,"All Channels","Variance","Units")
One guessed argument we should correct: „Variance“.The correct formula has to use „Actual“ instead of “Variance”:
=PALO.DATAC("localhost/Biker","Orders","All Orders",Year_selection,"Year","All Products",$E4,"All Channels","Actual","Units")
On the Design tab, click the Designer preview icon ![]() to see the result:
to see the result:
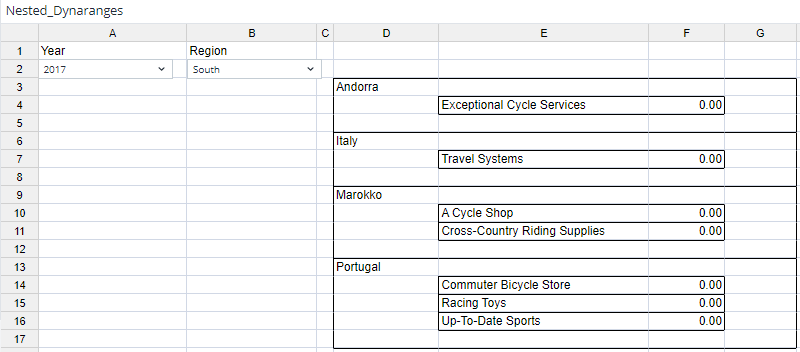
For performance reasons, a maximum of four elements will appear for each dimension in Designer preview.
To see a full view of all the data close Designer preview and click the Open user mode icon ![]() :
:
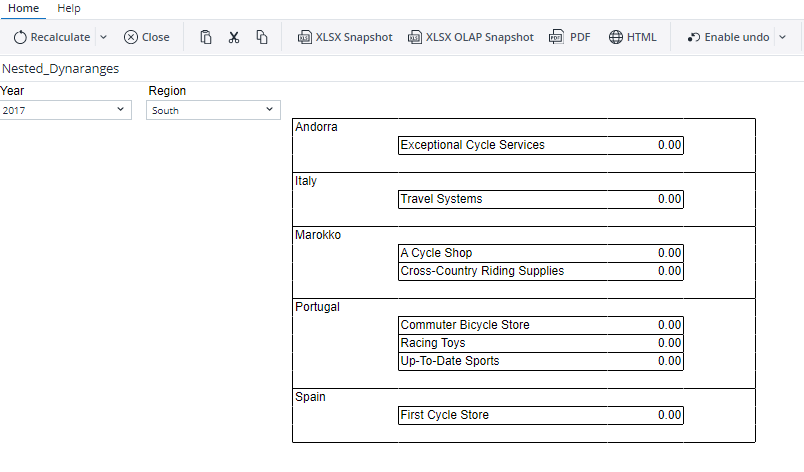
Now you can easily change „Year“ and „Region“ to see customers with 0 orders for certain years and certain regions.
Updated July 21, 2025