This article provides an example of a dynamic report with a ListBox and DynaRanges. For more information on these and other form elements, see the following articles:
Creating a List element
To create a new report with the List form element:
- In Designer, create the spreadsheet "Report 2".
- Double click on Report 2 and stay in cell A1. In the Insert tab, select the List element:

- The Format control dialog is displayed, prompting you to choose the settings for the list:
Note: there is a constraint for the data sources formula and ODBC query.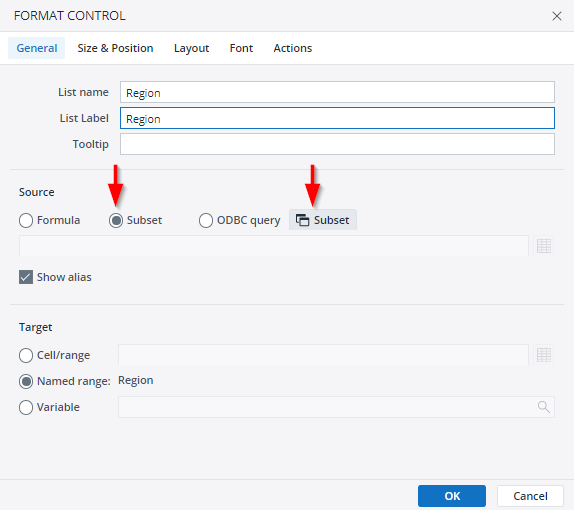
- Enter "Region" as the list name and label.
- Click on Subset to open the Subset Editor.
- On the General tab, select the server/database Demo and the dimension Regions.
- Activate the filter on the Hierarchy tab and check the box Filter elements by level.
- Select Start level 1 and End level 3 and click OK.
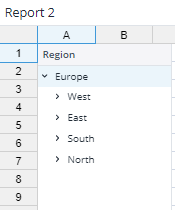
- Close the Format control dialog box by clicking OK. The following list appears:
Creating DynaRanges
To create DynaRanges, follow these steps:
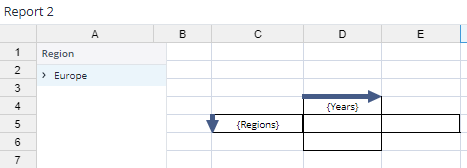
- Select D4:D6 and go to Insert. Click the Horizontal DynaRange icon.
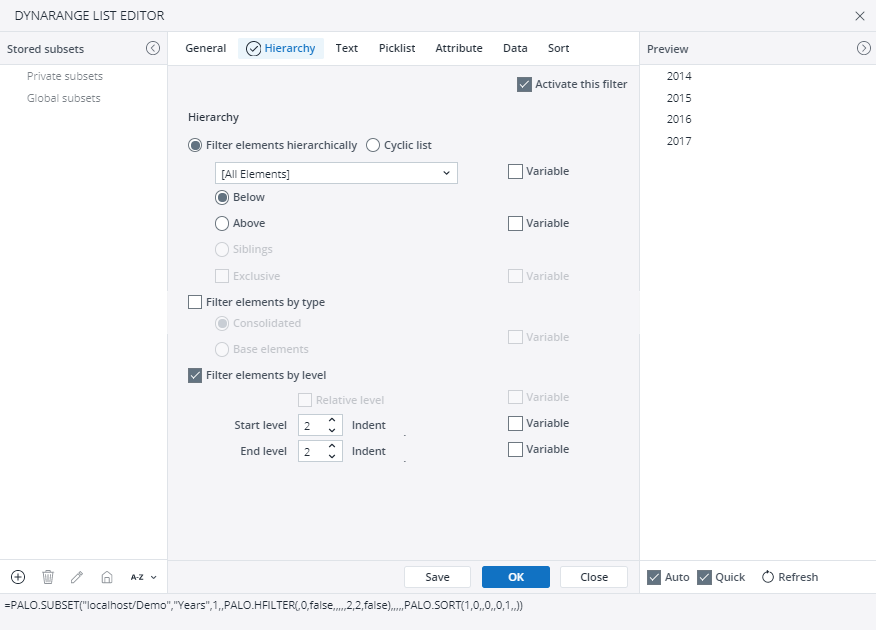
- As source, use a subset.
On the General tab, select the Demo database and the dimension Years. - Activate the filter on the Hierarchy tab and select the second hierarchy level of the Years dimension:
- Highlight C5:E5 and click the Vertical DynaRange icon from the Insert tab.
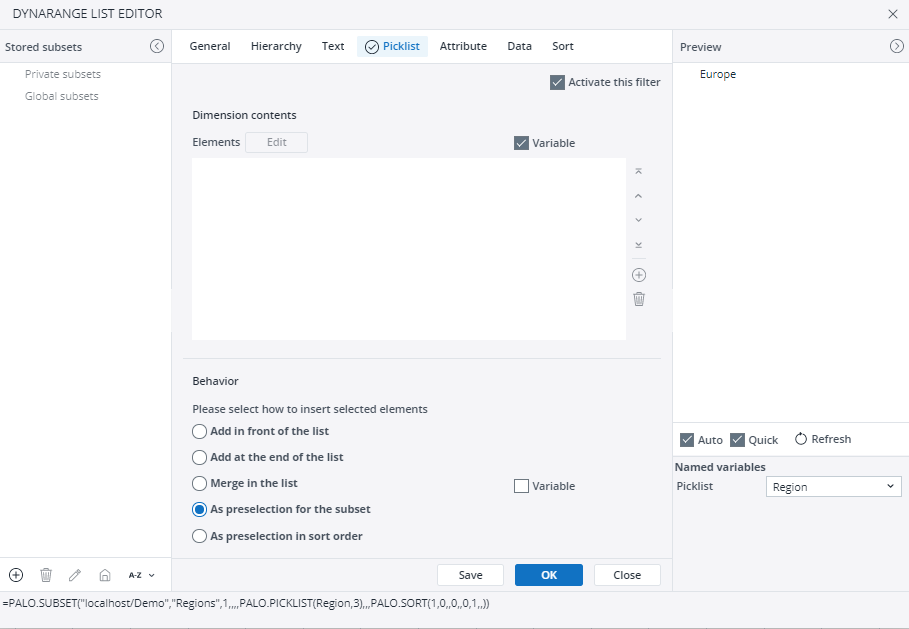
- Select Subset as a source.
- On the General tab, select the Demo database and the dimension Regions.
- Activate the filter on the Picklist tab, and check the top Variable box.
- Select Region as variable and select the option As preselection for the subset in the Behavior field:
-
The following data is displayed on the spreadsheet:
Add a PALO.DATA function in D5:
- Select Query > Paste Data Function…
- In the dialog box, select the database and the cube and check Guess Arguments. Click Paste.
- Right-click D5 and select Format cells from the context menu.
- Set the number format to 0 decimal places and click OK.
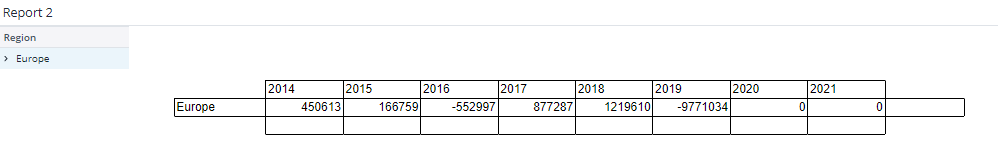
On the Design tab, click the Open user mode icon![]() to see the result:
to see the result:
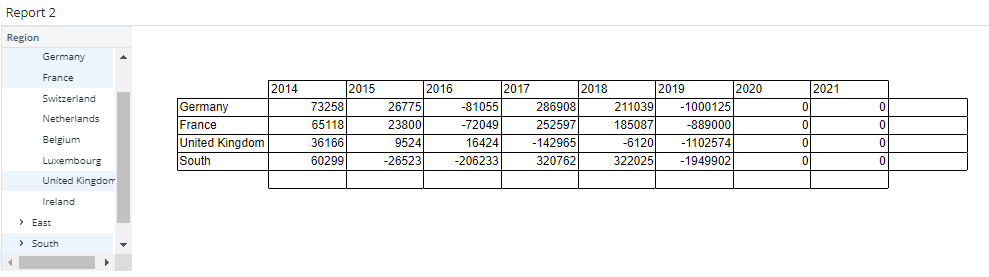
You can select multiple list items by holding down the CTRL key and clicking on the desired items. For example, in the screenshot below, Germany, France, United Kingdom, and South have been selected:
Save and close Report 2. Go to the Reports module and drag Report 2 onto "Reports" in the report group "Demo Reports", as shown below:
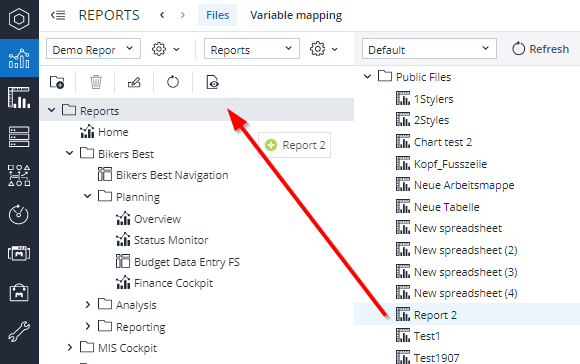
If you don’t want to make any other adjustments (e.g. variable setting), you can also assign opened spreadsheets and framesets from the Report Designer directly to a folder in the Reports module with File > Publish.
Updated July 3, 2025