Jedox Integrator is Jedox's Extract, Transform, and Load (ETL) software. This module is designed specifically to tackle the considerable challenges of importing and exporting large quantities of data to and from Jedox databases. It allows the extraction of data from heterogeneous sources, as well as the transformation and loading of master and transaction data into Jedox models. With the help of the Jedox Integrator, flexible data imports can be carried out easily and fully automatically. All established relational databases can be connected as data sources via a standardized interface. Furthermore, complex transformations and aggregations can be modeled.
Jedox Integrator is a client/server-based application, and the processes are managed in a user-friendly web interface. Integrator can also be easily integrated into other applications with various APIs.
Jedox Integrator can be operated within the Jedox Web interface
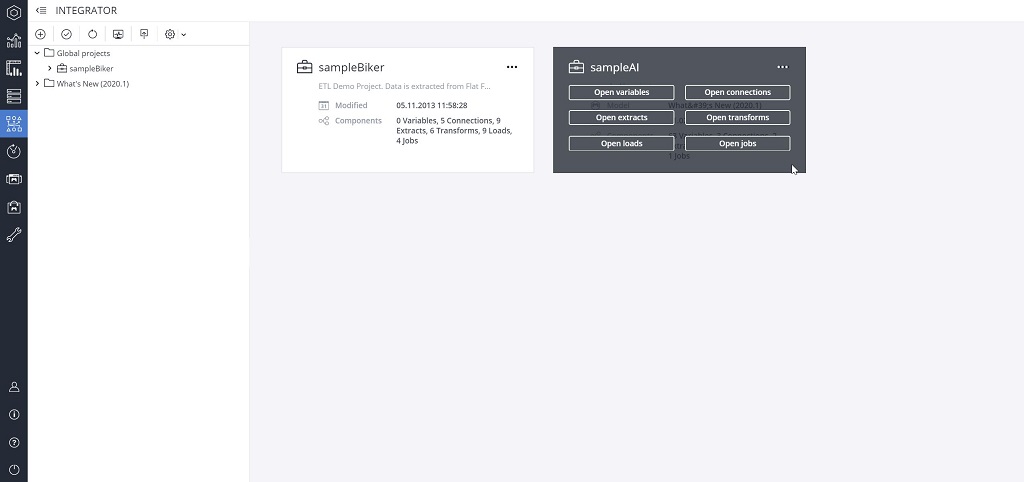
Hovering over any project in the Integrator enables the card functionality of that project. You can then navigate to one of the options in the card functionality, or simply enter that project by clicking on the card.
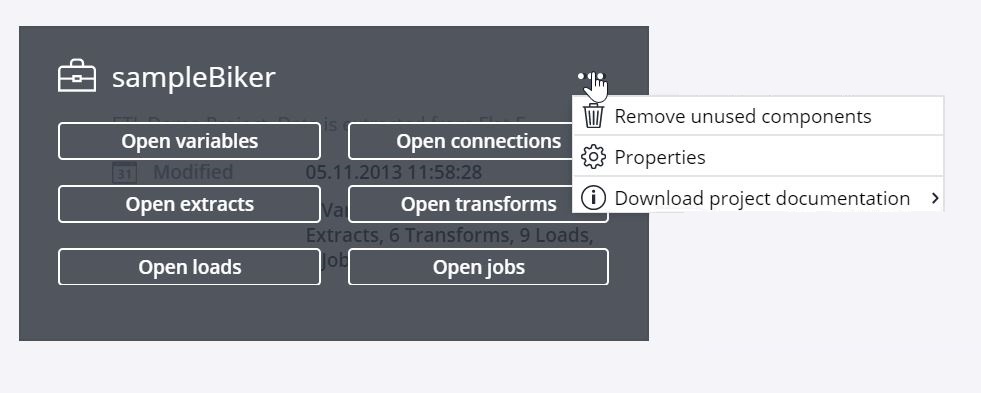
The dots icon ![]() in the upper-right corner of the card provides you with further actions.
in the upper-right corner of the card provides you with further actions.
If you have carried out a Jedox Integrator update installation, clear your browser's cache and your cookies to ensure that you are working with the most up-to-date Integrator.
Creating a new Integrator project
At the start of a new Integration process, a new project must be created. Alternatively, you can use an existing example or you can import a provided sample project.
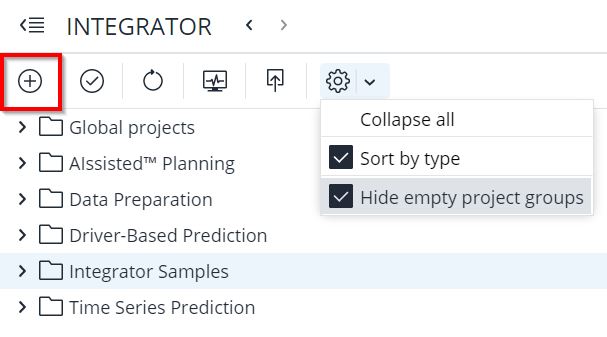
When you open the Integrator component, you will see the Integrator task buttons and the existing examples:
Task buttons (from left to right):
|
|
New Project |
|
|
Save all changes |
|
|
Refresh |
|
|
Monitor: displays an overview of the performed jobs and loads, detailed information about individual projects, execution types and logs, data preview and test. You can see running executions and logs, as well as stop them. |
|
|
Import: imports Integrator projects.
Note: when an Integrator project is imported from one environment to another, all connection passwords must be manually re-entered. |
|
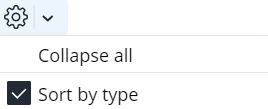
Collapse all: collapses all opened substructures in the Jedox Integrator projects list.
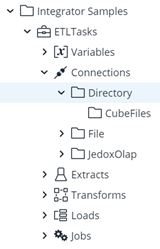
Sort by type: if set, then components are grouped by type and then by connection type (left picture below). If not set, then the components are not grouped by type (right picture below). |
| Grouped by type:
|
Not grouped by type:
|
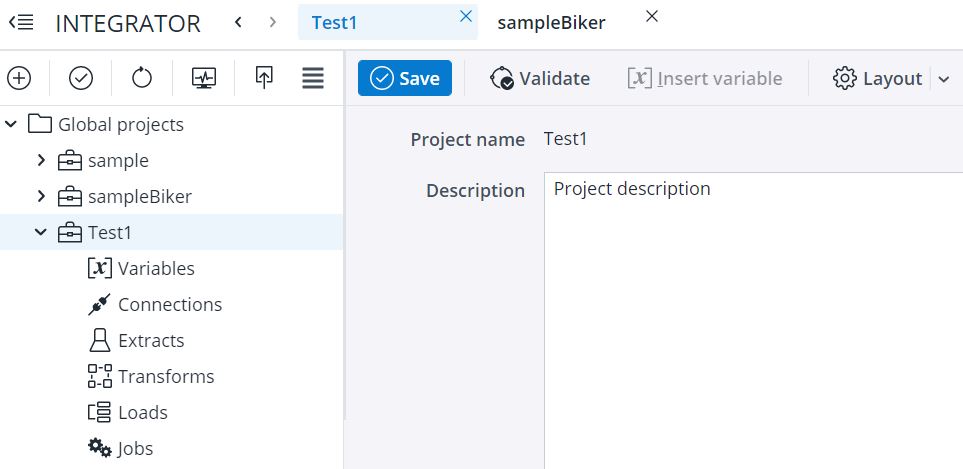
Create a new project and name it "Test1". It is created initially with an empty module structure.
Click on Test1 in the project list. Now you can enter a description of the project in the right window:
Click on the Save button in the toolbar when you have completed your description.
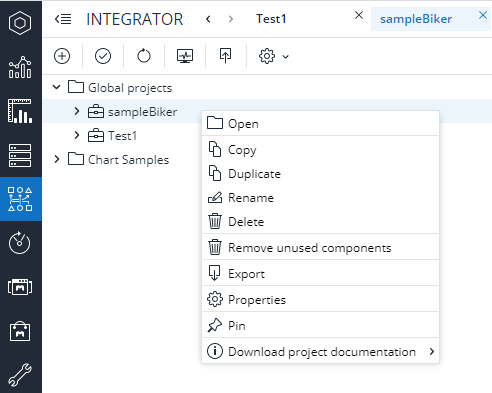
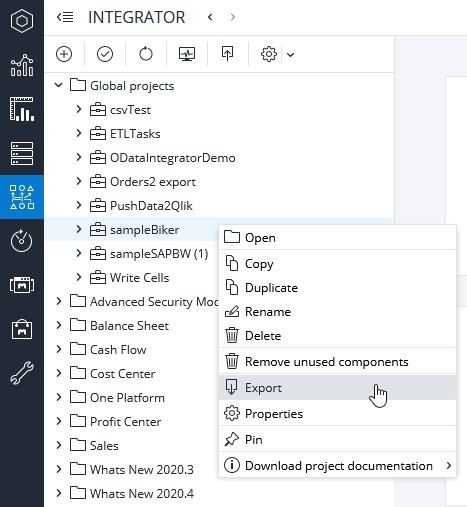
Context menu commands
By right-clicking on an element in the structure area you will receive corresponding context menu commands:
For the command "Rename" you can also use the keyboard shortcut F2.
Note: if parts of an Integrator project are scheduled, then renaming the project will result in error messages in the Scheduler .
The context menu for base components in Integrator is slightly different:
Creating a new component
By right-clicking on a module you can create a new corresponding element, or you can display an overview of the elements that exist in the selected component group.
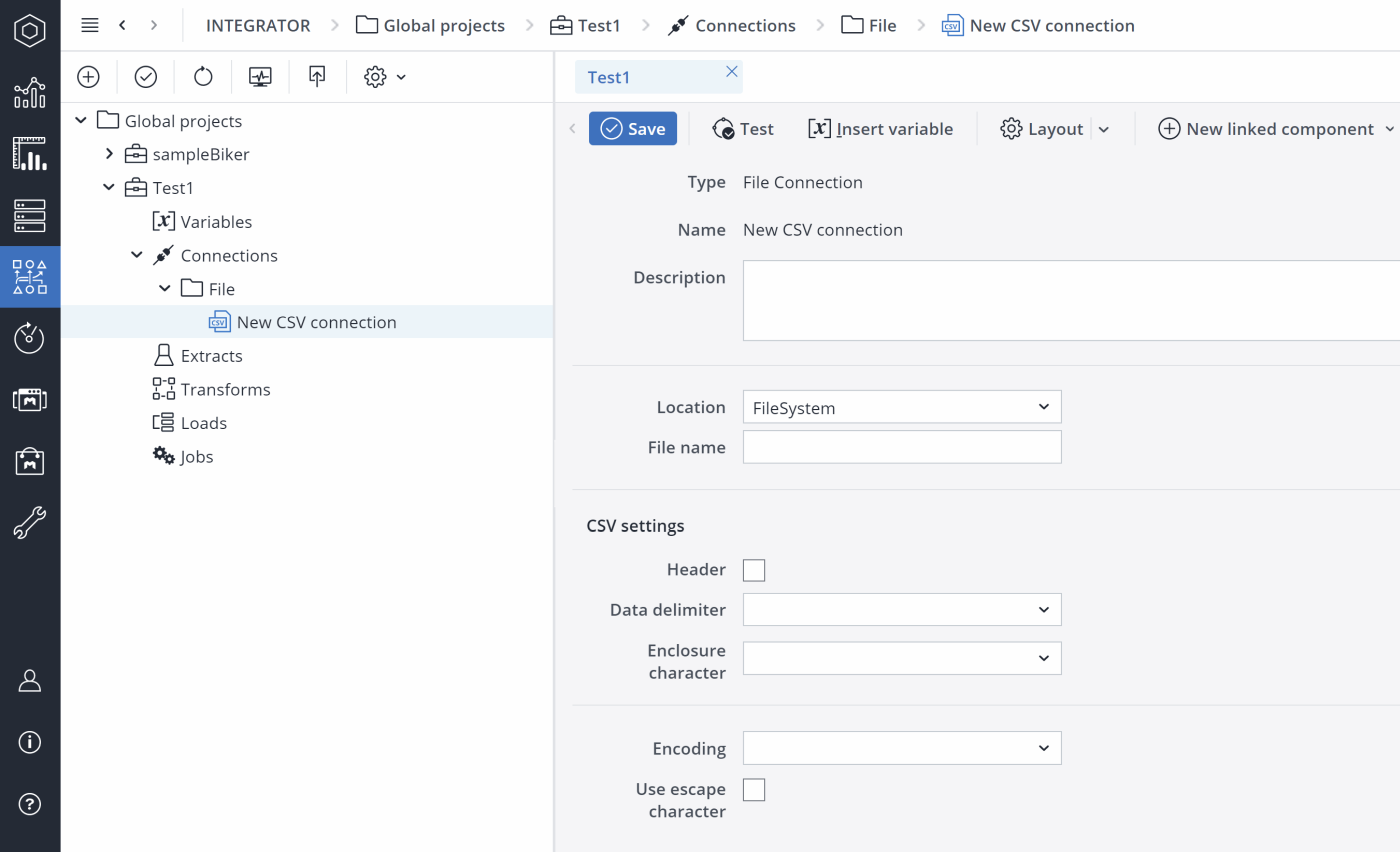
As an example, we will create a new connection, as shown in the screenshot below.
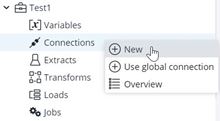
Next, select the connection type "CSV File" and give it a name. Select and click OK.
At the next screen, you can enter a description and make selections for settings:
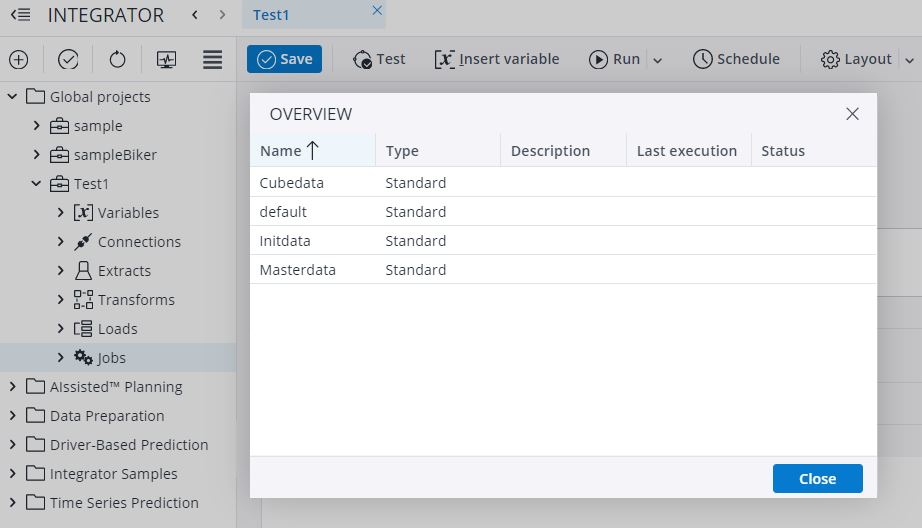
Right-clicking on a component group (Variables, Connections, Extracts…) under the project name, you can see an overview of the elements:
Here you can sort the elements by name, type, and description. Furthermore, you can resize this window and all displayed columns.
Double-clicking a component opens this component and closes the overview window.
Creating a new linked component
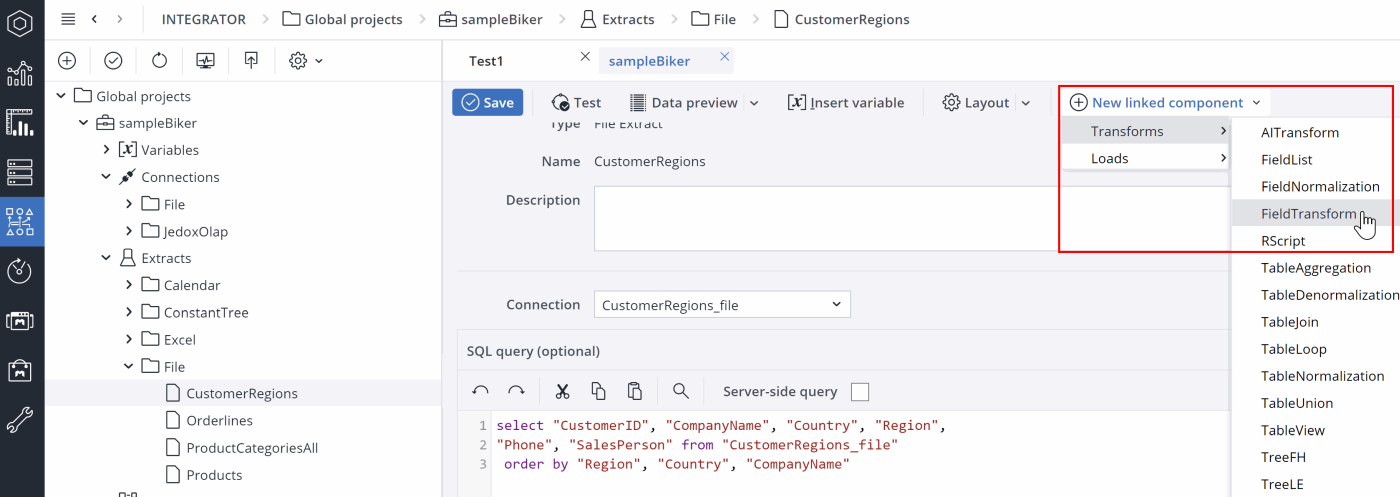
New components can be linked to existing components by clicking on the New linked component button in the existing component's toolbar. For example, you can create a new field transform directly from an existing extract. The new transform will automatically use the extract as a data source.
The menu is context sensitive and will show all viable components that can be linked from the existing component.
FlowGraph
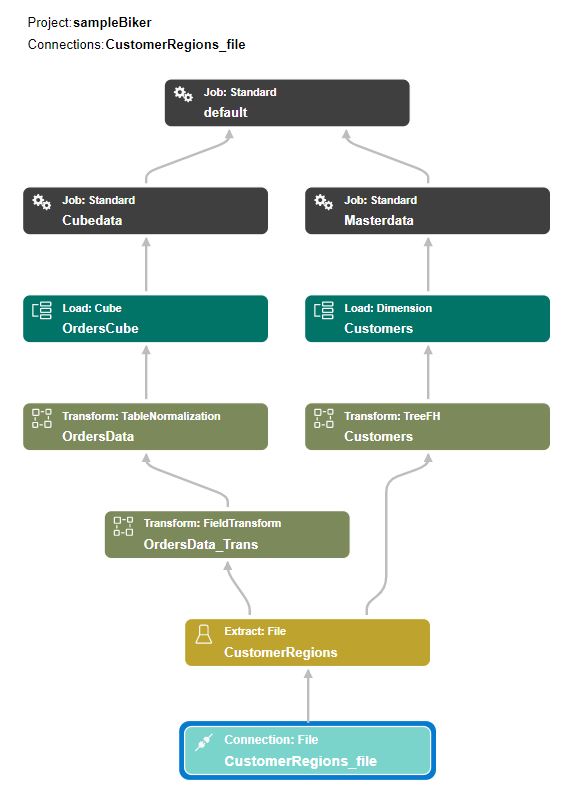
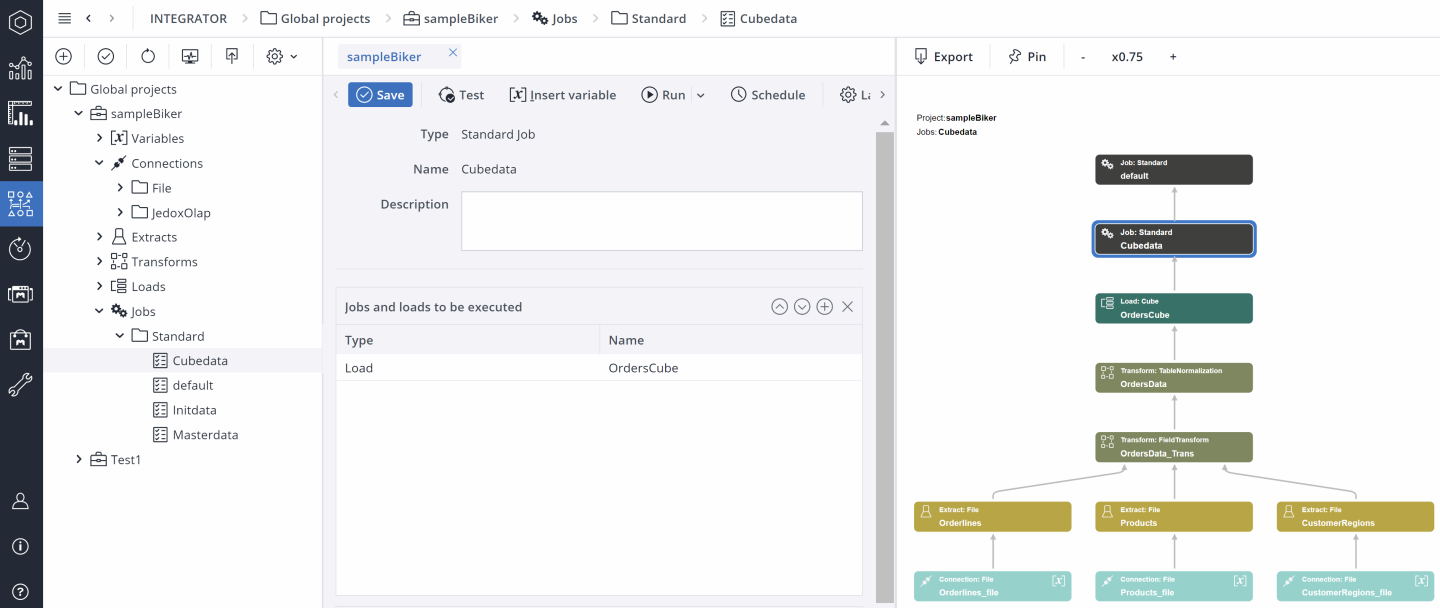
Jedox Integrator projects can become complex when many data sources, extracts, and transforms are necessary. The FlowGraph provides an overview of the whole Jedox Integrator process flow. It displays all preceding and subsequent components for the current component.
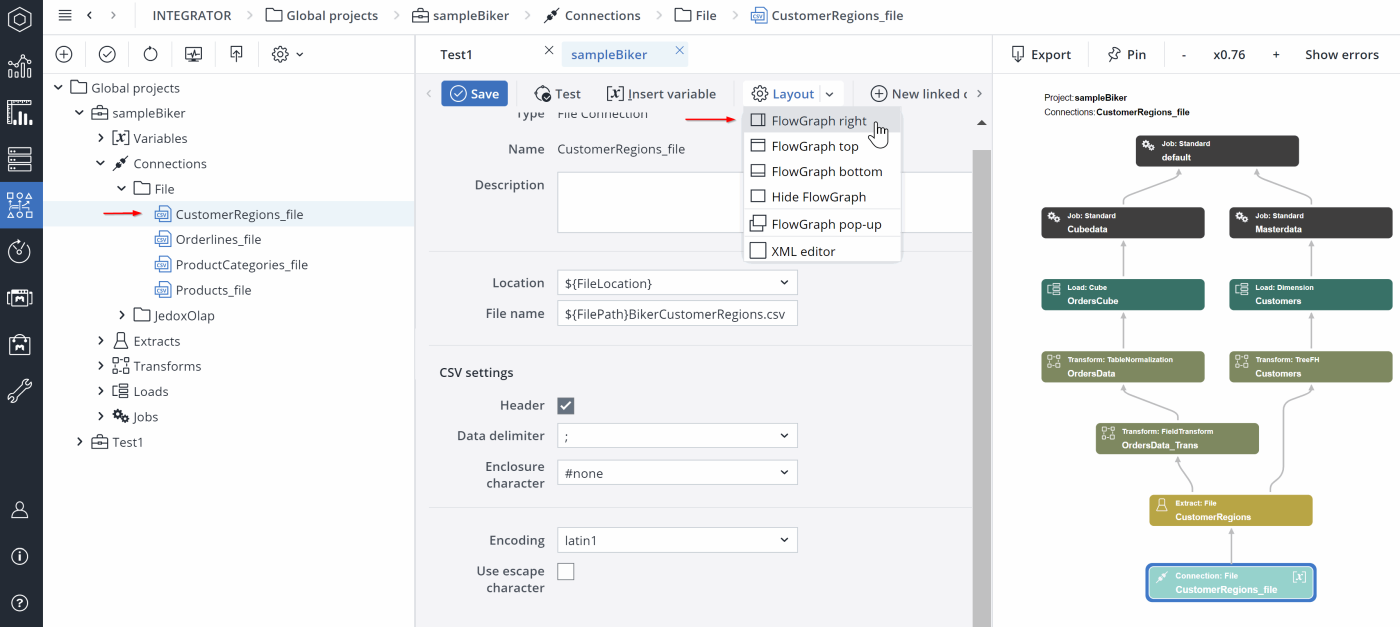
To generate a FlowGraph, click on the Layout button in the component Integrator (see screenshot below). Here you have several options for displaying your FlowGraph within the component Integrator.
The FlowGraph is only displayed in currently supported browsers. See Client Environments Supported by Jedox for more information.
Navigation with the FlowGraph
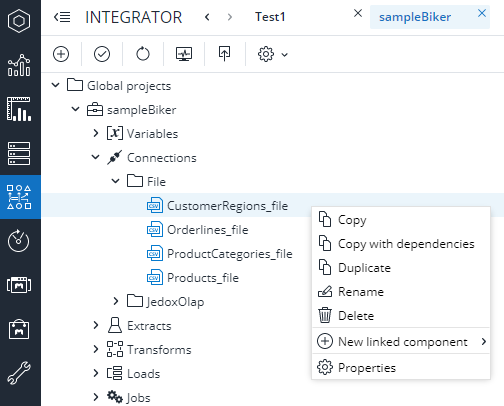
The Jedox Integrator makes it very easy to navigate step-by-step through an Integrator project. To see how this works, navigate to the demo project sampleBiker. In Connections > File double-click CustomerRegions_file, using the screenshot below as a guide. Click on the Layout button and select FlowGraph Right:
You can click on each element in the FlowGraph go view that component.
Testing a component
Each component of a Jedox Integrator project can be tested individually. To do so, select a connection in the tree on the left side and click Test.
FlowGraph errors
When errors appear in the Integrator Flow Graph, users can click the button "Show errors" in the Flow Graph menu to see specifically where the errors are occurring:
Data preview in Extracts and Transforms
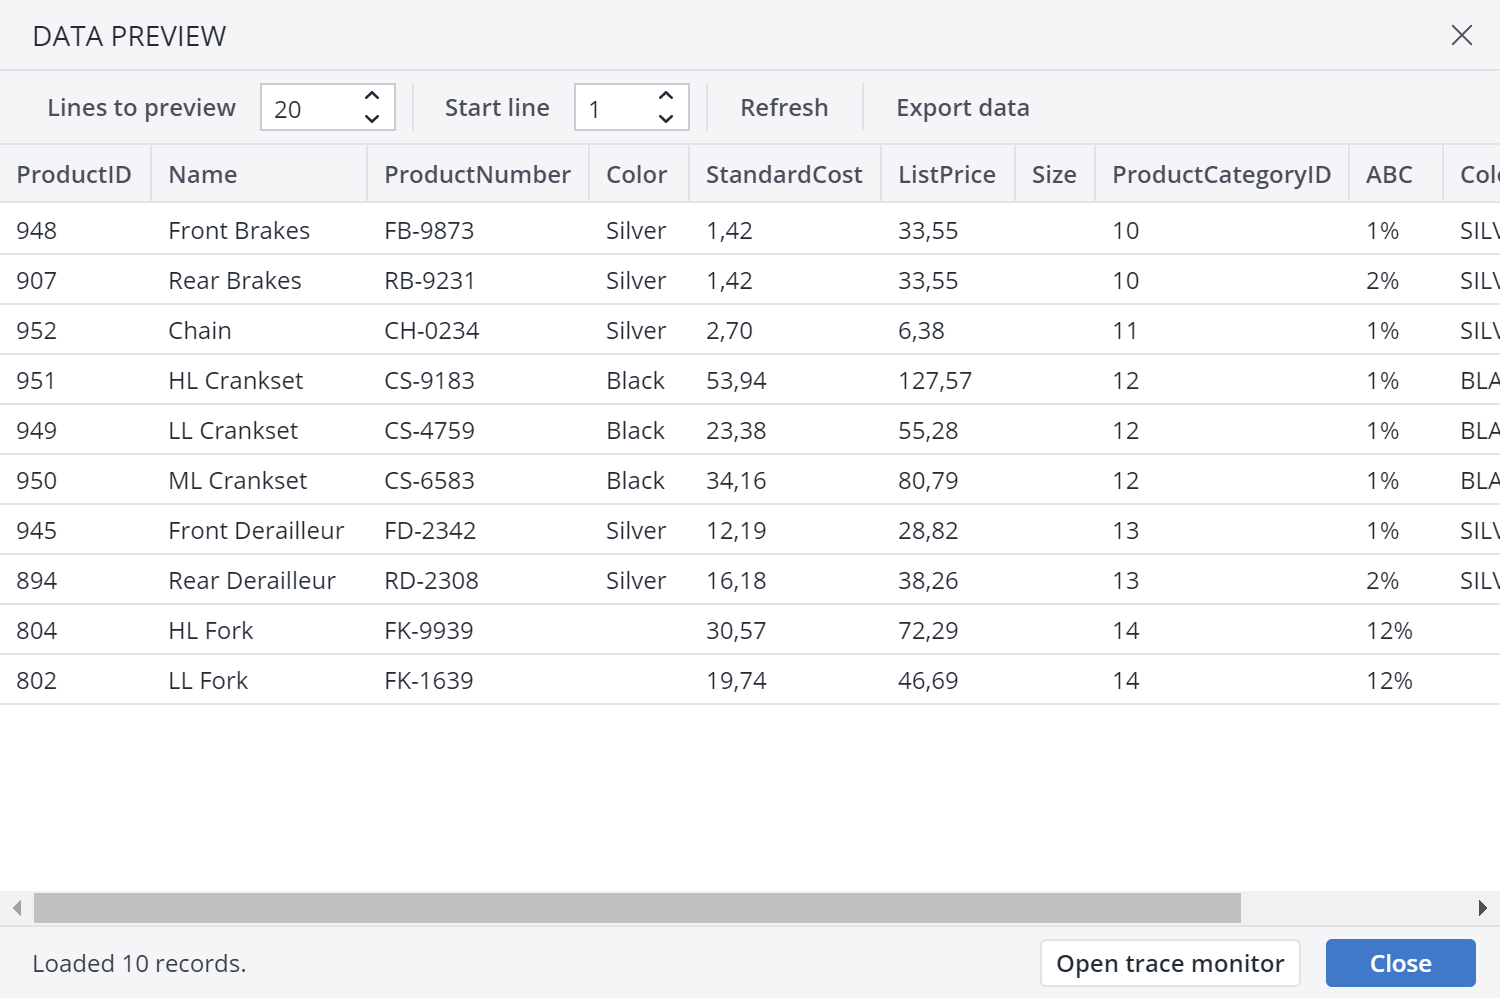
In Extracts and Transforms, it is possible to have a preview of the data before running them, to check the accuracy of the data during the Modeling.
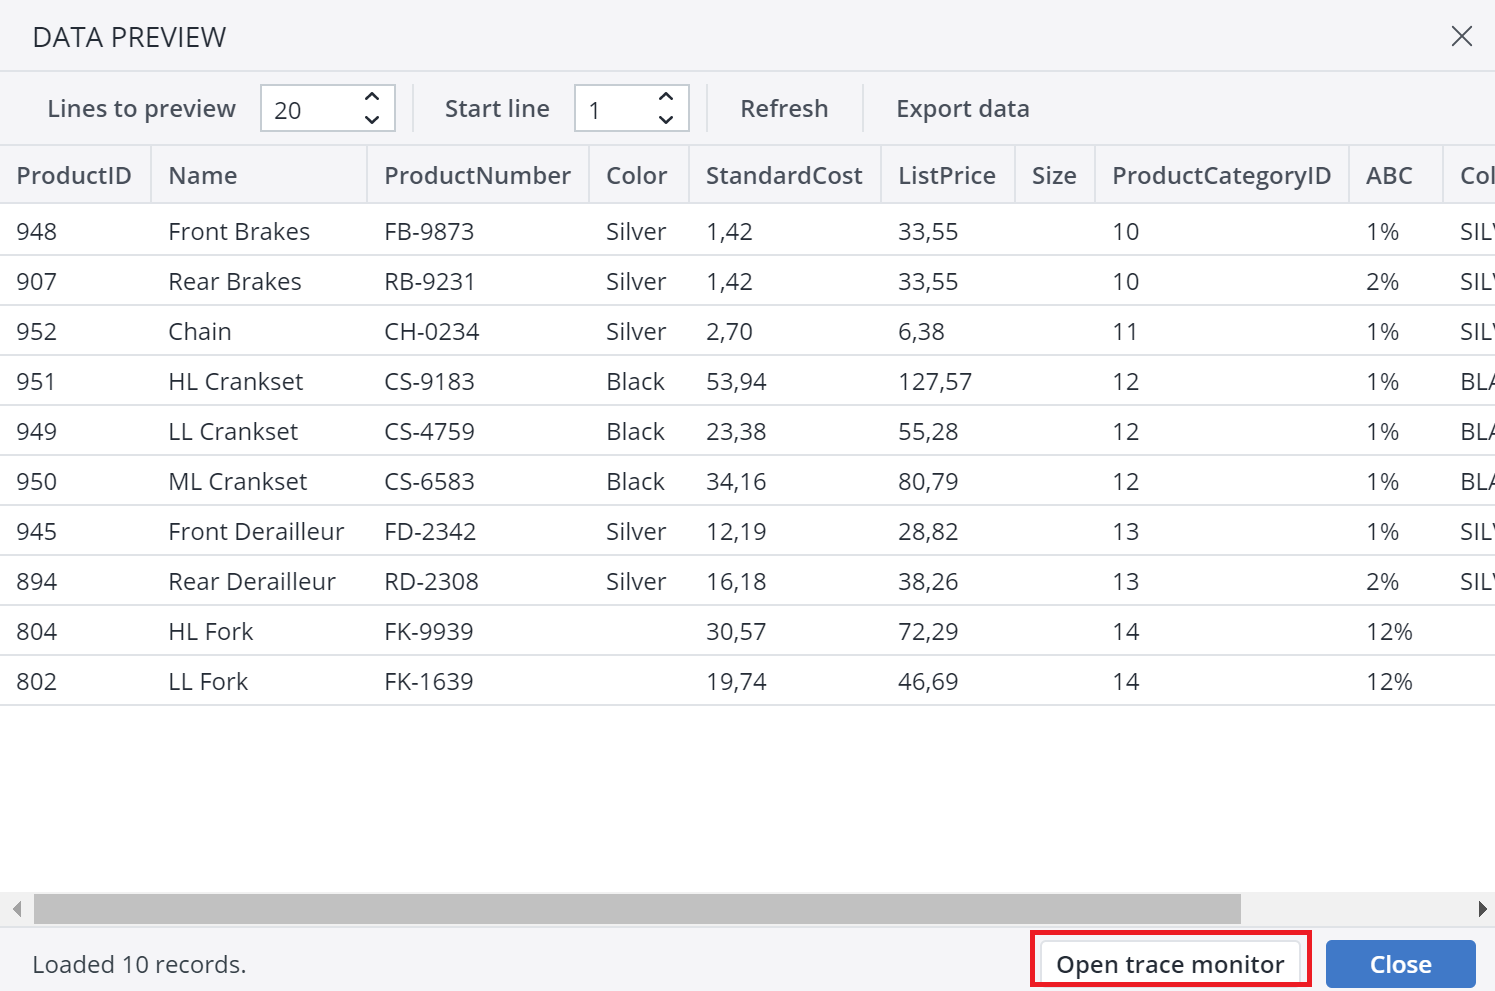
To open the data preview, choose any Extract or Transform, then click on Data preview or Data preview with options. Data preview with options allows you to change the variable temporarily and just for this preview. It does not change the variable value permanently.
You can set the number of lines to show in the preview through Lines to preview. You can also set the Start line and the Format, which is by default NONE. Once you set the desired numbers, click on Refresh, and the Data Preview will update.
Tracepoints
Jedox has a special function called TracePoints that allows you to view information about how a particular value has changed during the Integrator process. Once a Tracepoint has been activated, you can view the process in the Trace Monitor, which is accessible through the Data Preview dialog.
Executing a job
The final stage of the execution of a Jedox Integrator process is carried out via a Job. To see a demonstration of an Integrator process, navigate to Jobs > Standard in the sampleBiker project (refer to the screenshot below). Double-click on Cubedata, click Run and confirm the execution.
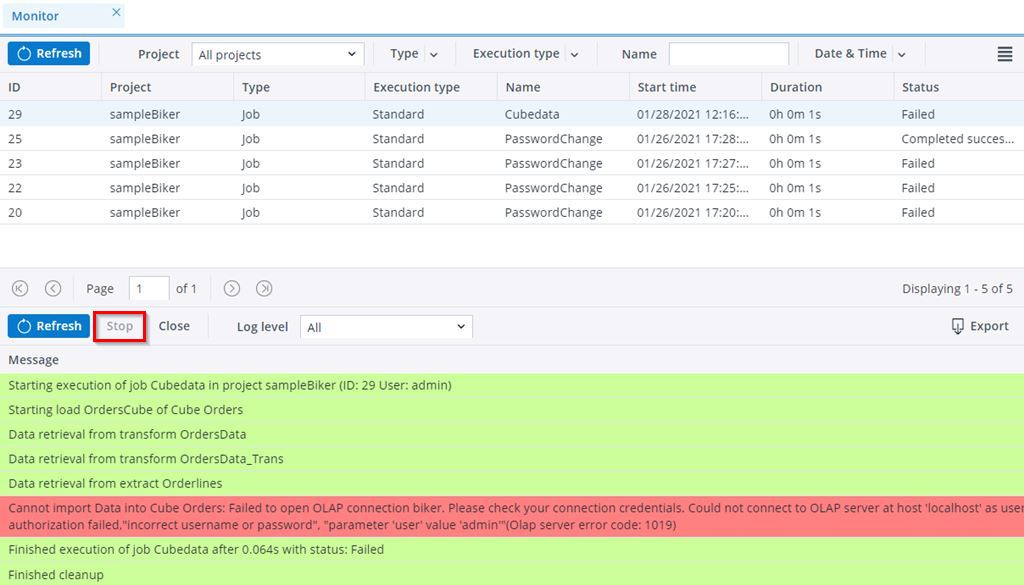
The result appears in the Monitor tab, as shown below.
This job shows an error, because it requires execution of the Initdata and Masterdata jobs to create the necessary dimensions.
Run with options
Run with options, available by clicking on the arrow on the Run button, allows you to change the variable temporarily and just for this execution. It does not change the variable value permanently. Run with options is available for Loads and Jobs.
Stopping the execution of a job
To stop the execution of a running job (status “Running”) click on the Stop button (which is no longer active in the screenshot above) in the Integrator's Monitor. Jedox Integrator will then try to terminate the execution of this job. After termination, the status is set to “Interrupted”.
Note: in some cases, stopping an execution may take a longer time (e.g. if a long-running request has been send to a source or target system). In this case, the status “Stopping” is displayed in the monitor. By clicking the Stop button a second time, an interrupt signal is sent to the thread of this execution. In most cases the execution will then be interrupted.
Scheduling a job
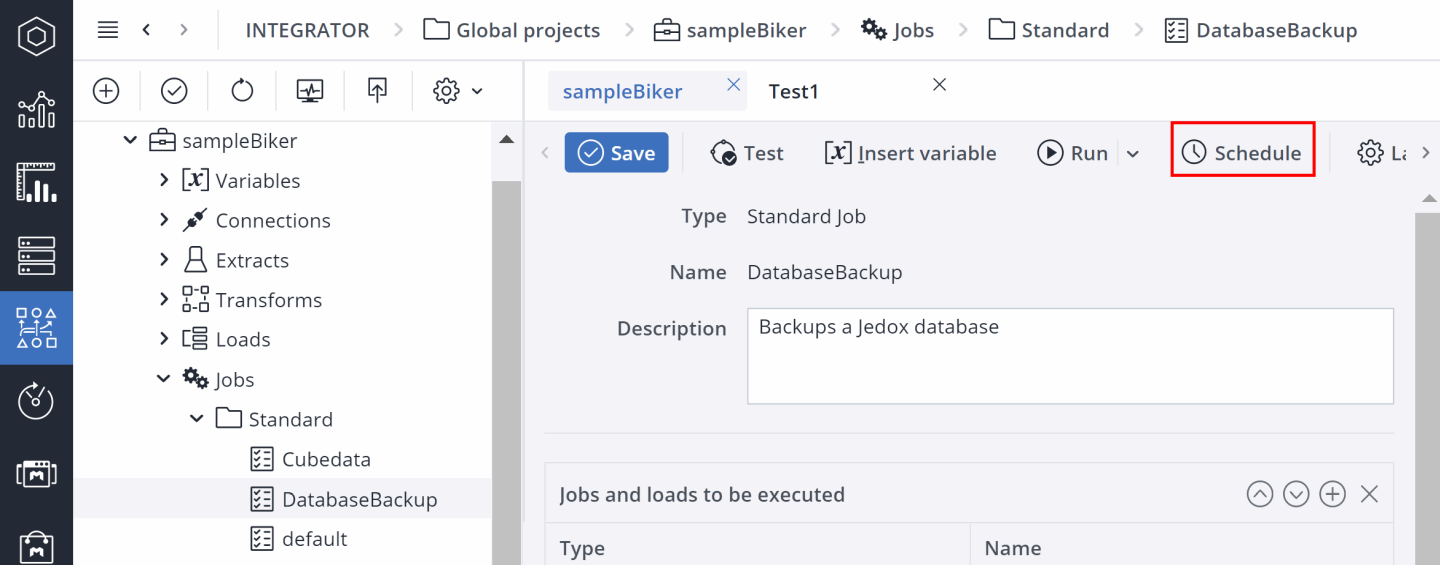
Integrator jobs can be scheduled directly in Jedox Web. Select a job on the job overview page and then click the Schedule button:
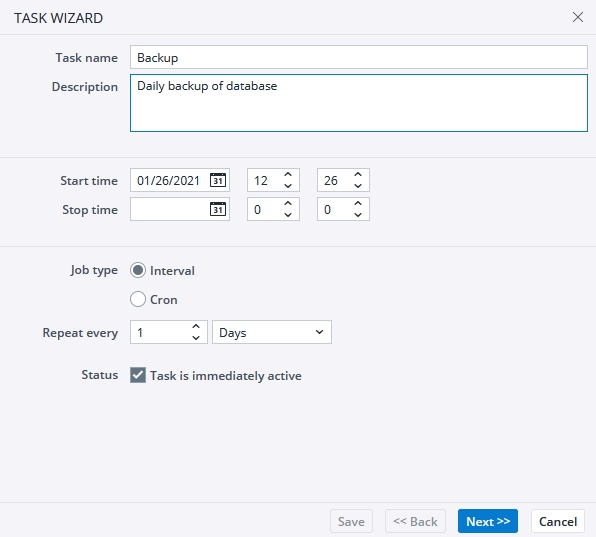
The Task Wizard appears. Here you can set the schedule for the job.
When you click Next, you will be prompted to set up notifications for groups or users.
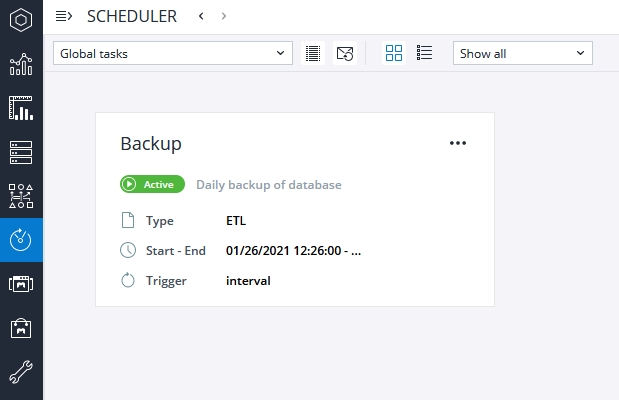
All settings can be changed later using the Scheduler component. Click on the Scheduler icon in the navigation bar to view all scheduled tasks.
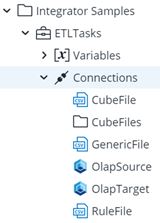
Integrator sample projects
A good way to get familiar with the Jedox Integrator functionality is to try out the sample projects. After the software installation, you will find two sample projects in the Integrator:
- sampleBiker project: this project is helpful for getting a first impression of how to use Jedox Integrator for loading data to an OLAP database.
- ETLTasks project: this is a rather complex project that includes jobs for some often-recurring general tasks, like DatabaseCopy, CubeAnonymize, etc.
Backing up an Integrator project
Make sure you export your projects as XML files to create regular backups.
To export a project, right-click it in the Integrator Project list and select Export:
This allows you to restore your integrator project from backup in case it gets damaged.
Updated July 21, 2025
