Jedox Canvas is a responsive, free-scrolling, interactive pinboard for Jedox visualizations, views, actions, and more. With Jedox Canvas, you can combine your content from different business functions in one place and get a complete overview of your comprehensive planning and analysis activities. A Canvas reacts flexibly to the varying screen sizes and repositions content as the screen sizes change. You can format specific aspects of the Canvas, such as background colors, or borders. Canvas sheets can also be exported as PDF files for printing and distribution.
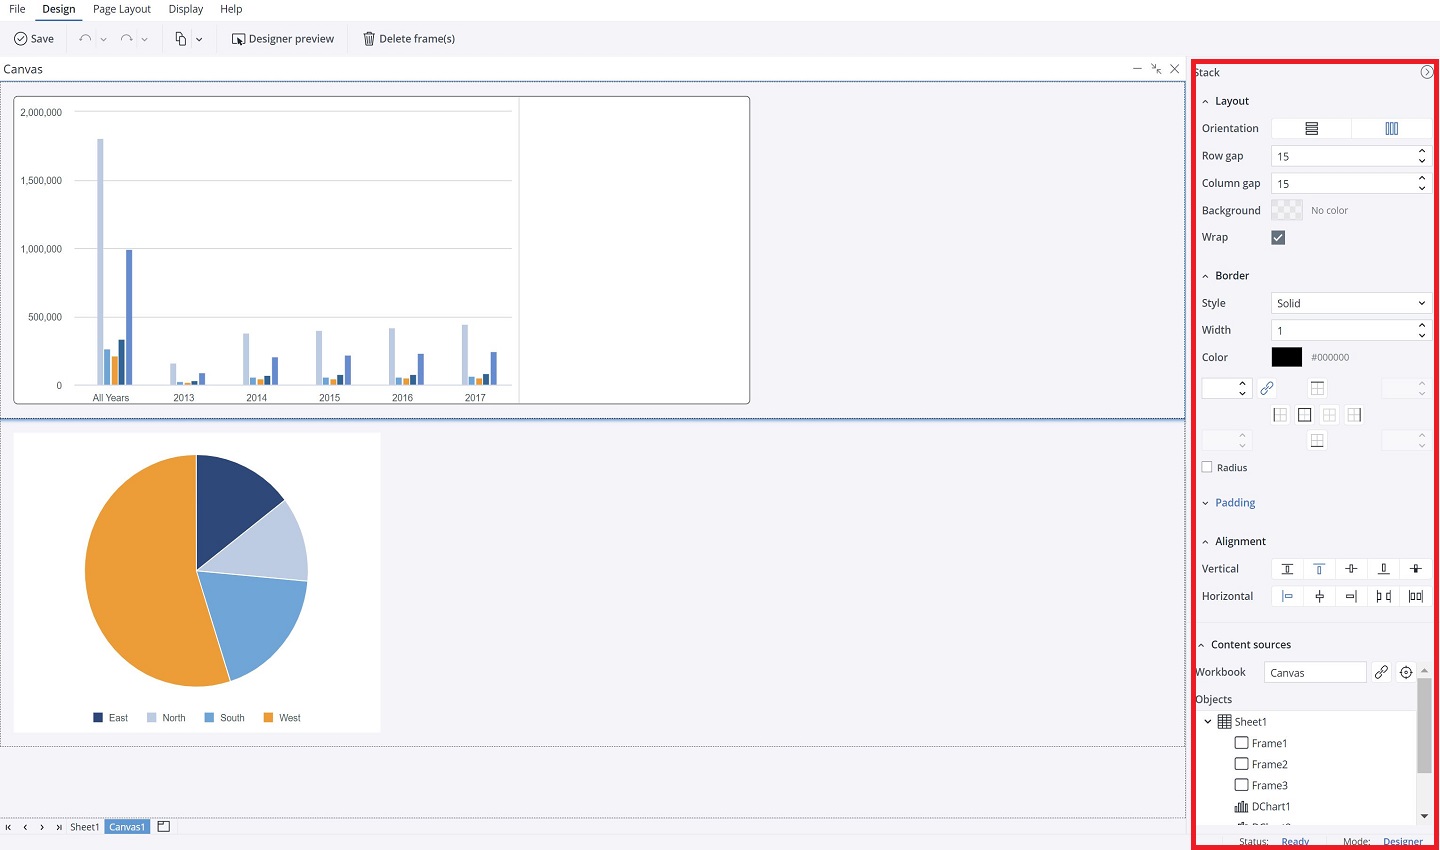
Inside a Canvas, content objects are grouped into Stacks. Each stack has properties for its size, layout, and the positioning of content inside it. Stacks can also be nested.
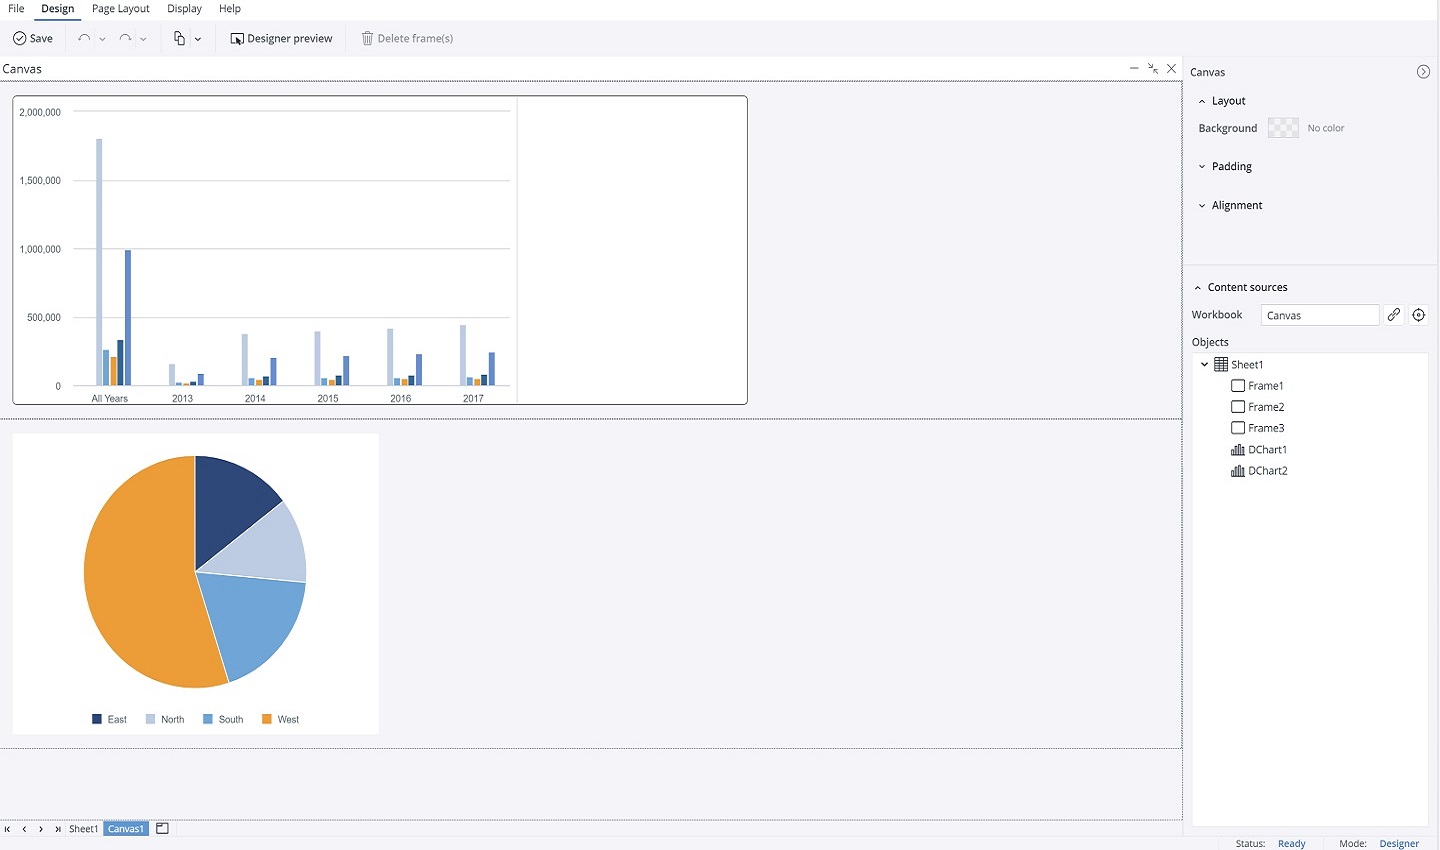
There are three levels inside of a Canvas:
- The Canvas itself, i.e., the "container" for the objects
- Stacks for grouping objects together
- Frames which display the actual content
Even though stacks are used to group objects, groups are only optional in a Canvas, and a Canvas could also consist only some Frames.
There is also no “user preview” in a Canvas sheet, as it is already shown as it appears to an end user.
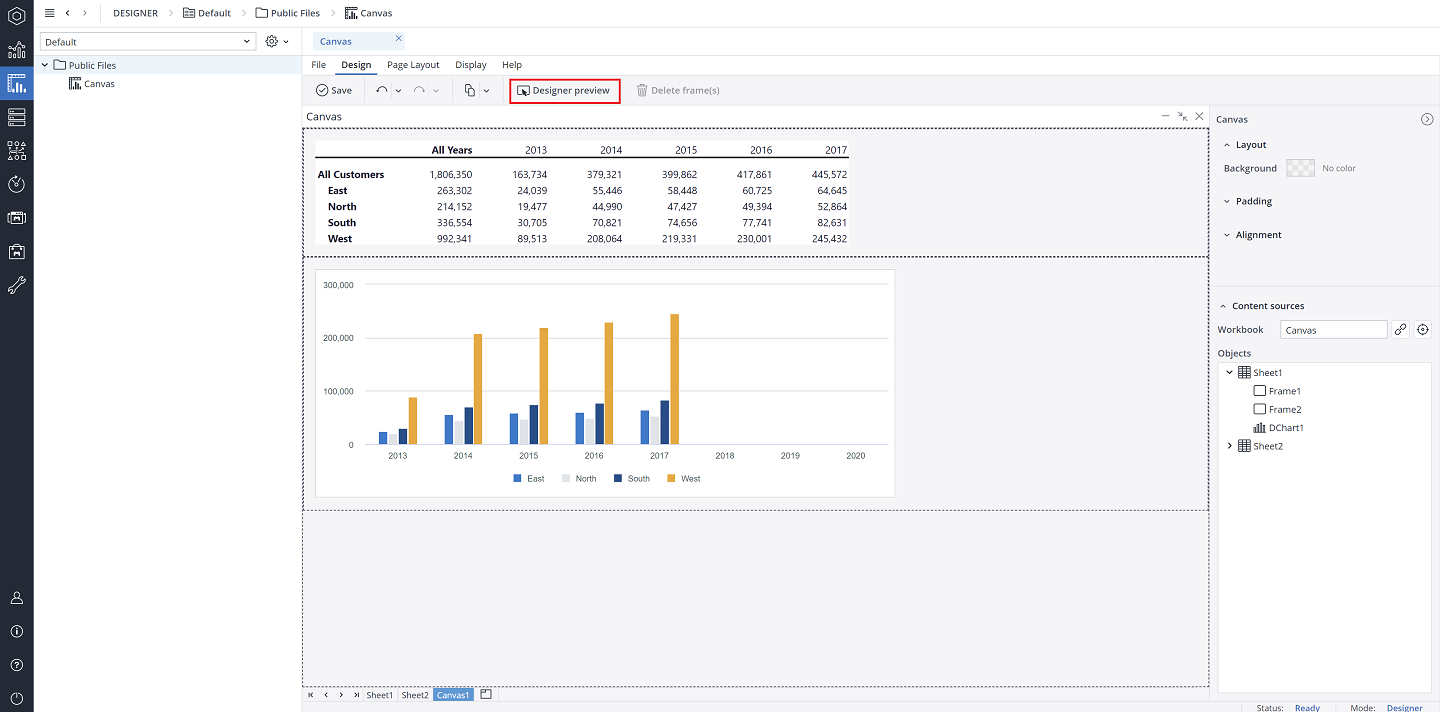
Edit mode and Interaction mode
There are two modes within a Canvas: Edit mode and Interaction mode. Edit mode, which is the default mode, enables the designer to control the objects in the Canvas. Interaction mode shows the end-user experience, whereby designer functionalities are disabled. Designers can toggle between the two modes by clicking on the Designer Preview.
Canvas Inspector
Once inside a Canvas, you can use the Inspector panel on the right side of the screen to define the layout of a Canvas. See Canvas Inspector for more information.
Responsive display feature
Jedox Canvas is designed with a responsive display feature, enabling you to check how your Canvas looks in different screens/ devices. Click on the Responsive dropdown menu in the Page Layout, and choose your device, or customize the screen size you wish to check your Canvas on.
Automatic resizing
Based on content changes, such as expansion/contraction of a DynaRange or stored View, Stacks and Frames are automatically resized. Also, when you change the size or properties of a frame in a Canvas, the adjacent frames are automatically resized so that the relationship and perspective for related data are kept.
Variables in Views
As a report designer, you can use variables in Views and then use the View as a part of a dynamic Canvas that automatically responds to changes in those variables.
In the Designer mode, you can select an @variable for any dimension in a View. The @variable can be set in the Select Elements dialog.
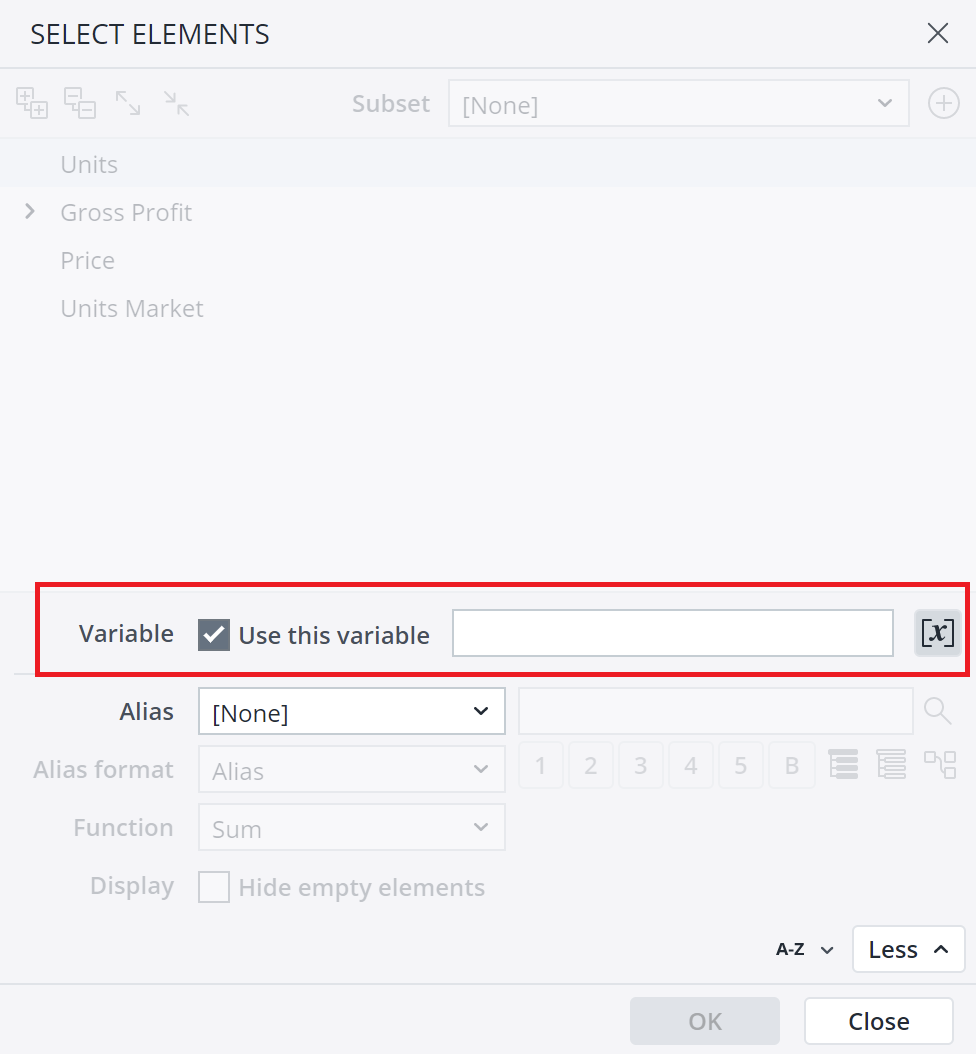
If multiple values are selected (for example, via a list box) for a variable, based on the dimension’s location, two results are possible:
-
Rows & Columns: multiple items are displayed
-
PoV & Sources: multiple items are selected, and the aggregation method is set to Sum.
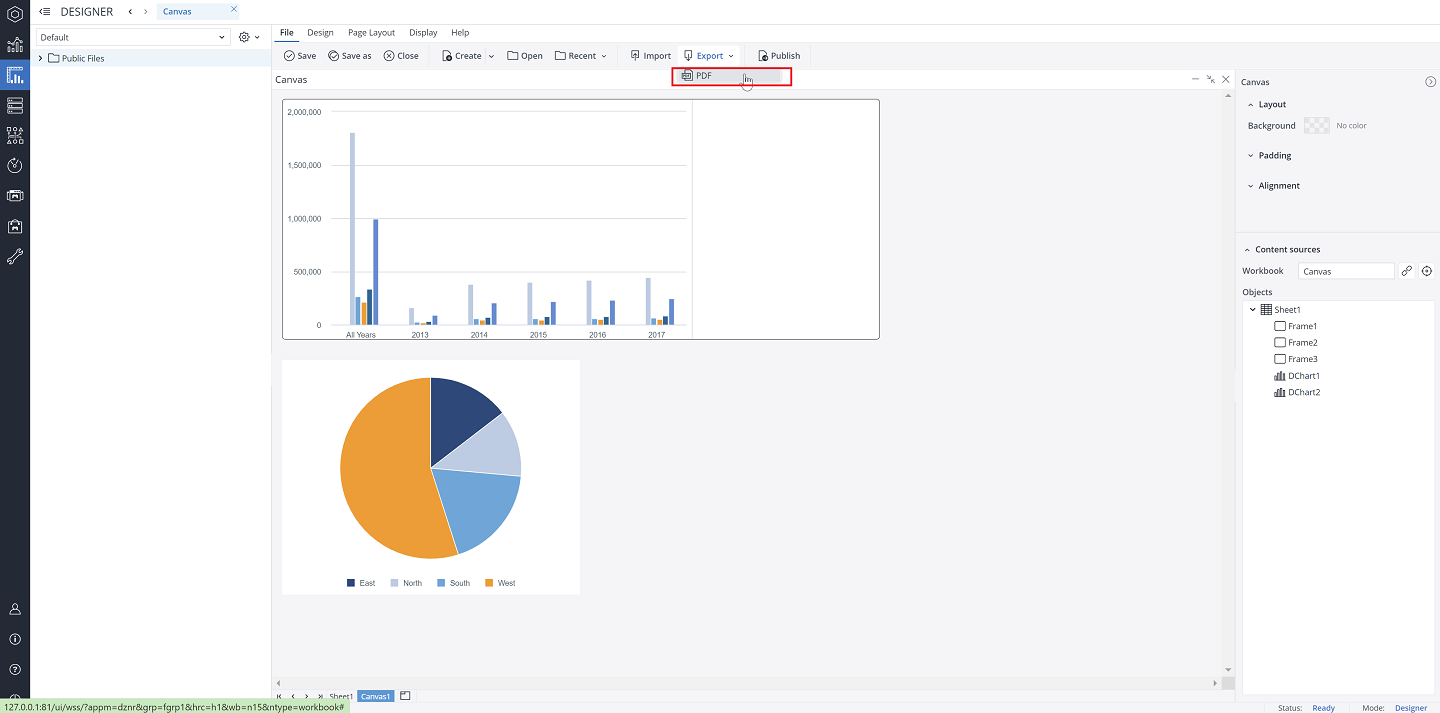
Exporting Canvas as PDF
To export a Canvas sheet as PDF, go to File > Export, and click on PDF. The resulting PDFs are suitable for printing and distribution
Updated July 3, 2025